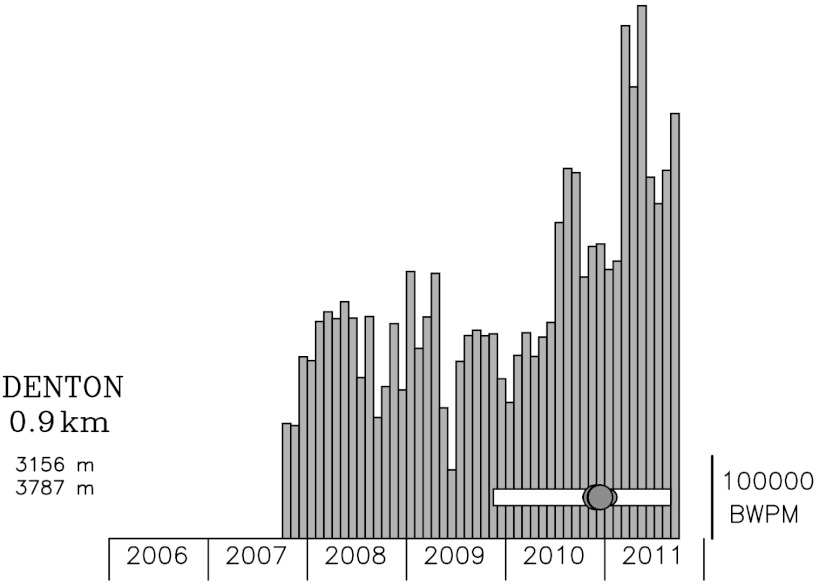
Fig. 3.
Monthly injection rates at the injection well near the Denton earthquake group identified in this study. Scale bar at right of histogram is 100,000 BWPM (16,000 m3/mo). The rectangle shows the time period of study; dark circles indicate earthquakes located in this study. Labels at Left indicate distance to epicenter and depth interval of injection. Injection rates for all other wells within 5 km of A- and B-quality epicenters are plotted in Figs. S2 and S3.

