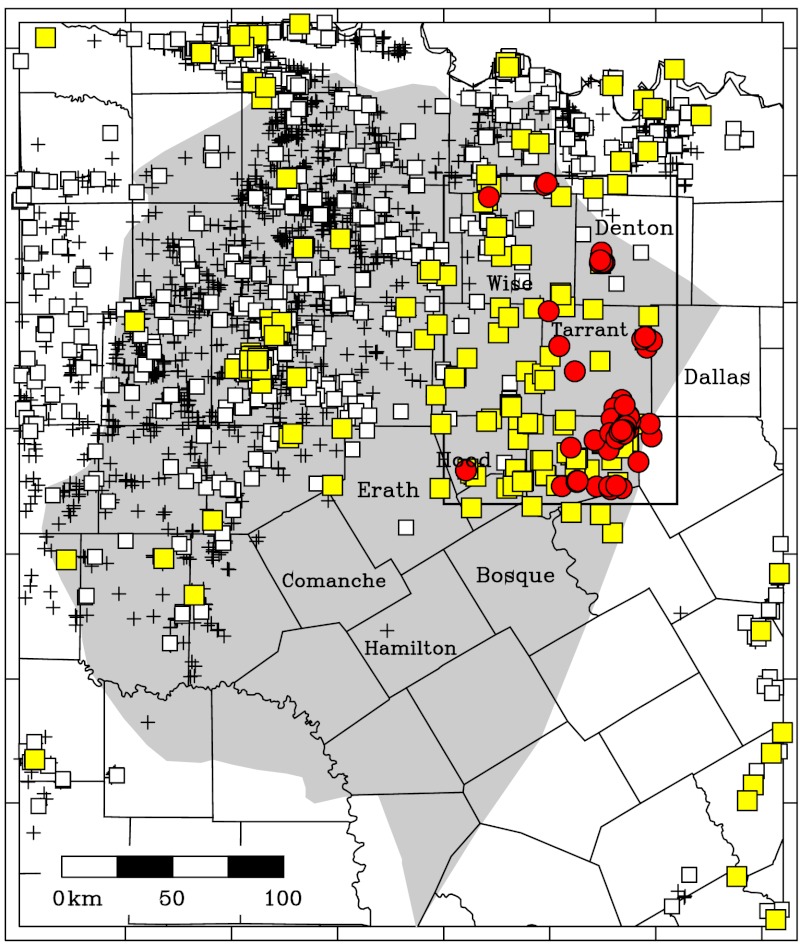
Fig. 5.
Map of Barnett Shale area as in Fig. 1, showing earthquakes located in this study (red circles) and injection wells in use since 2006 (squares and + symbols). Yellow squares are wells reporting maximum monthly injection rates exceeding 150,000 BWPM (24,000 m3/mo); white squares, exceeding 15,000 BWPM (2,400 m3/mo); + symbols, exceeding 1,500 BWPM (240 m3/mo).

