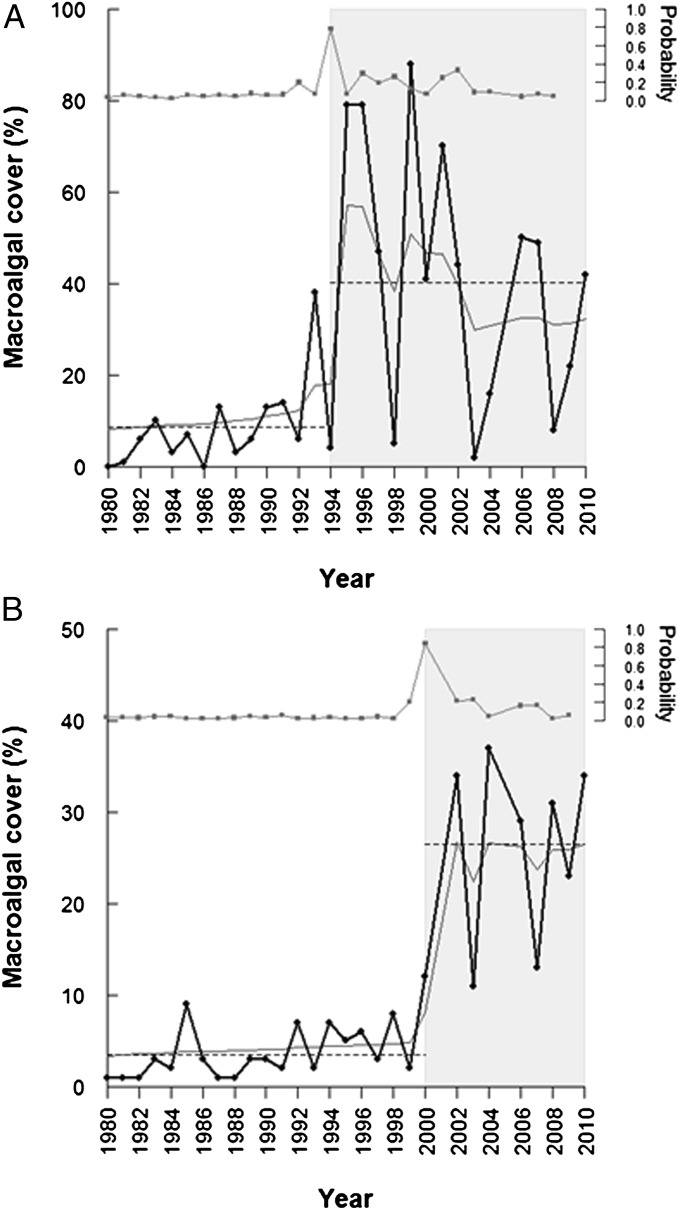
Fig. 3.
Time series of macroalgal cover in two Arctic fjords. (A) In Kongsfjord, erect filamentous brown algae increased abruptly in 1995 (change point estimate). (B) In Smeerenburgfjord, erect brown and red algae showed a sudden increase in 2000 (change point estimate). The dotted line shows the sample mean for the two regimes (white and gray shaded areas), and the lower gray line shows the posterior mean. The upper gray line shows the posterior probability (secondary y axis) of a change point (regime shift) in macroalgal cover taking place at a given time.

