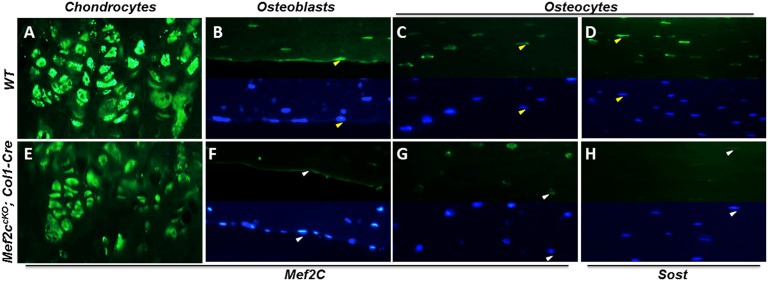
Fig. 3.
Mef2CcKO;Col1-Cre mice have reduced Mef2C and Sost bone expression. Mef2C protein expression is unchanged in chondrocytes (A and E). On the periosteal surface, most osteoblasts were positive for Mef2C in the WT (B; positive cells are marked by yellow arrows) and this expression was absent in Mef2CcKO;Col1-Cre (F; negative cells are marked by white arrows). Fewer cortical osteocytes expressed Mef2C in Mef2CcKO;Col1-Cre (G; white arrows point to Mef2C negative cells) relative to WT (C, yellow arrows point to Mef2C positive cells). A significant reduction in Sost-positive cortical osteocytes was also observed in Mef2CcKO;Col1-Cre (H; white arrows mark Sost negative cells) relative to WT control (D; yellow arrows mark Sost-positive cells). In B–D and F–H, Upper is the Mef2C protein signal in the green channel, and Lower is the same image showing the cell nuclei (blue channel/DAPI); arrows point to the same cells visualized in the green and blue channel.

