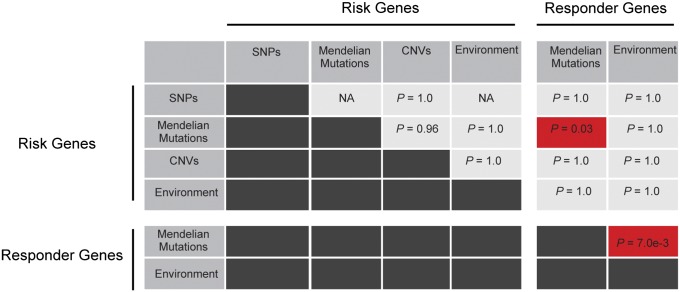
Fig. 4.
Pairwise comparisons of direct convergences of risk and responder datasets. Genes (Table 1) were compared using hypergeometric statistics to assess signficance of overlap between datasets of varying sizes and corrected for multiple testing. Shading denotes significant (red) or insignificant (grey) direct convergence. SNPs within Mendelian CHD genes and environmental target genes are not independent and were excluded (NA).

