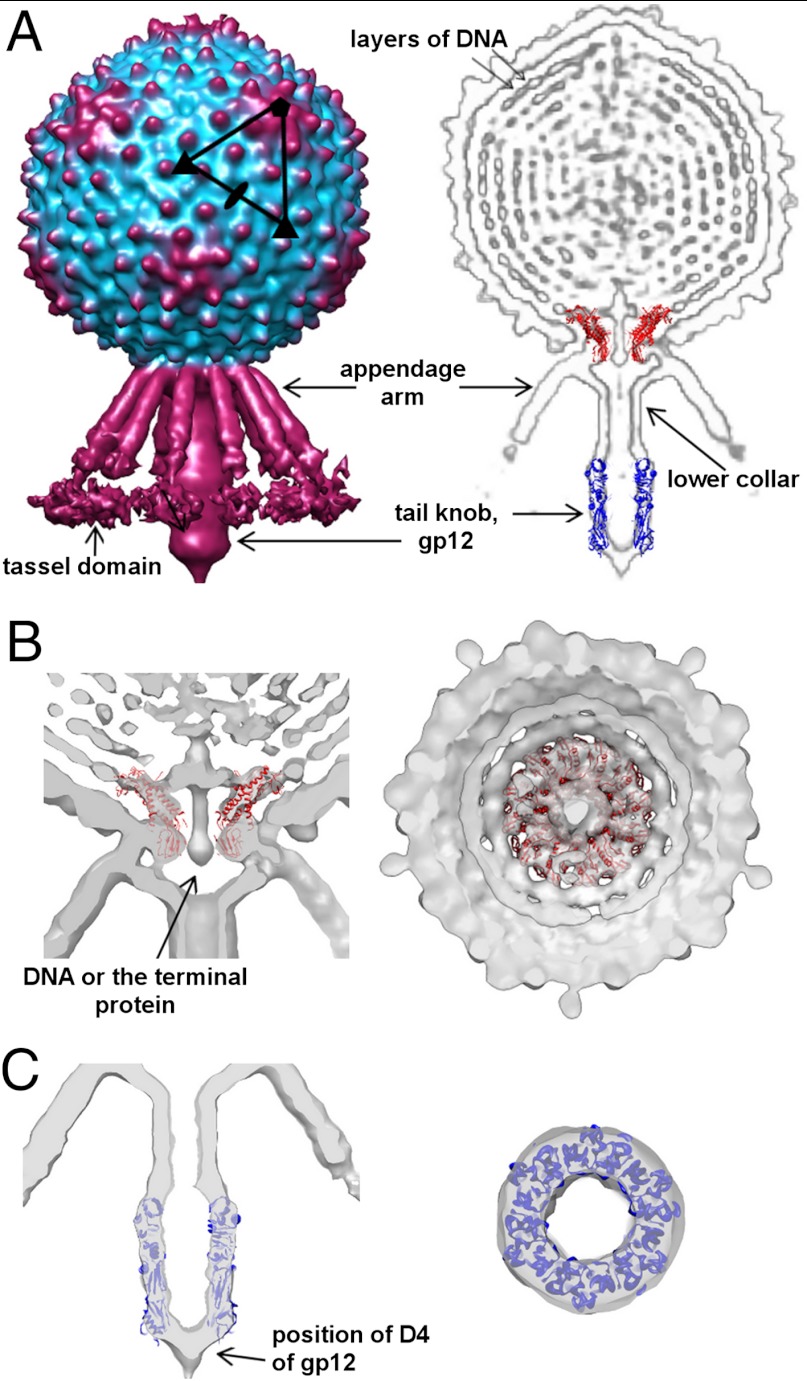
Fig. 2.
Asymmetric reconstruction of the C1 virion. (A) Surface representation of the C1 virion (Left) and cross-section through the bacteriophage, showing different components of the virus (Right). The structure of the φ29 connector and the C1 major tail protein was fitted into the electron density. (B) Two orthogonal cross-sections through the cryo-EM density map, showing the fit of the φ29 connector. (C) Two orthogonal cross-sections through the cryo-EM density showing the fit of gp12 into the knob.

