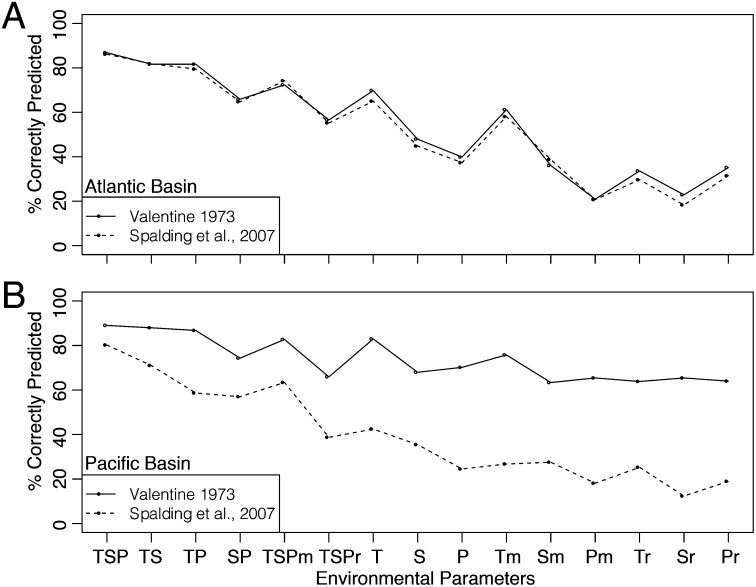
Fig. 2.
Percentage of grid cells correctly predicted by nested multinomial logistic regressions where nested sets of oceanographic variables are used to predict BU membership at the basin scale for two biogeographic schemes. T, temperature; S, salinity; P, net primary productivity; m, mean annual values only; r, seasonal ranges only. Both mean annual values and seasonal ranges are used as predictors unless otherwise specified. See Tables S4 and S5 for corresponding AIC values and for coastline-scale analyses.

