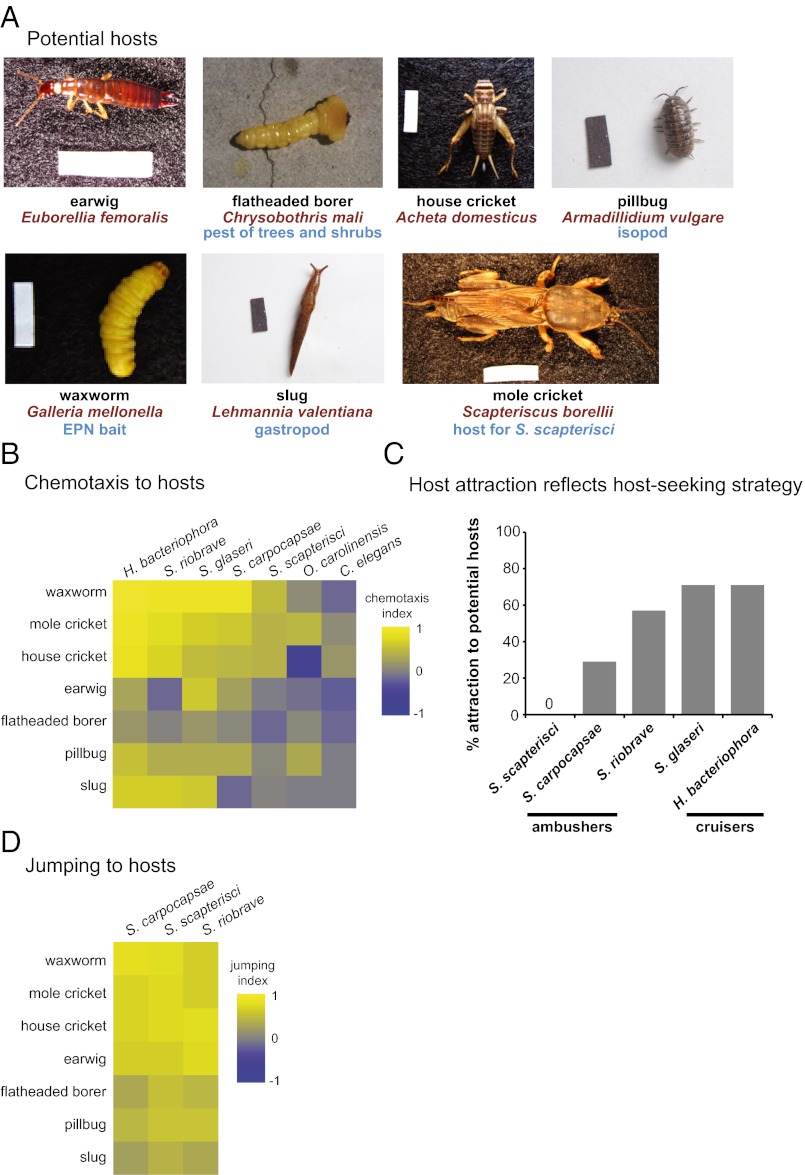
Fig. 1.
EPNs respond differently to different potential hosts. (A) Potential invertebrate hosts tested. Mole crickets, earwigs, flatheaded borers, pillbugs, and slugs were collected from the greater Los Angeles area. Waxworms and house crickets were purchased commercially. (Scale bars: 1 cm × 2.5 mm.) (B) Chemotaxis of EPN IJs and C. elegans dauers to volatiles released by live potential hosts. The order of both the nematodes and the hosts in the heatmap was determined by hierarchical cluster analysis (Ward’s method). EPNs respond differently to different hosts (P < 0.0001), different hosts evoke different overall responses from EPNs (P < 0.0001), and different EPNs show different odor–response profiles (P < 0.0001; two-factor ANOVA with replication, with a Bonferroni posttest). n = 6–30 trials for each EPN-host combination. Mean, n, and SEM values for each assay are given in Dataset S1; P values for each posttest are given in Datasets S2 and S3. (C) Chemotaxis behavior reflects host-seeking strategy, so that cruisers display more overall attraction to hosts than do ambushers. The y-axis indicates the percentage of hosts that were strongly attractive (as defined by a chemotaxis index of ≥0.5). S. scapterisci and S. carpocapsae are cruisers, S. glaseri and H. bacteriophora are ambushers, and S. riobrave employs both cruising and ambushing strategies for host seeking. The responses of the ambushers S. scapterisci and S. carpocapsae cluster separately from the responses of the cruisers S. glaseri and H. bacteriophora and the ambusher/cruiser S. riobrave by k-means cluster analysis and hierarchical cluster analysis (Ward’s method, cophenetic correlation = 0.85). (D) Jumping of EPNs in response to volatiles released by live potential hosts. The order of the nematodes in the heatmap was determined by hierarchical cluster analysis (Ward’s method); the order of the hosts is the same as in B. EPNs respond differently to different hosts (P < 0.0001), and different hosts evoke different overall responses from EPNs (P < 0.0001) (two-factor ANOVA with replication, with a Bonferroni posttest). However, different EPNs do not show significantly different odor–response profiles (two-factor ANOVA with replication). n = 2–13 trials for each EPN–host combination. Mean, n, and SEM values for each assay are given in Dataset S1; P values for each posttest are given in Datasets S4 and S5. In B and D, response magnitudes are color-coded so that a chemotaxis index or jumping index of +1 is yellow, −1 is blue, and 0 is gray.

