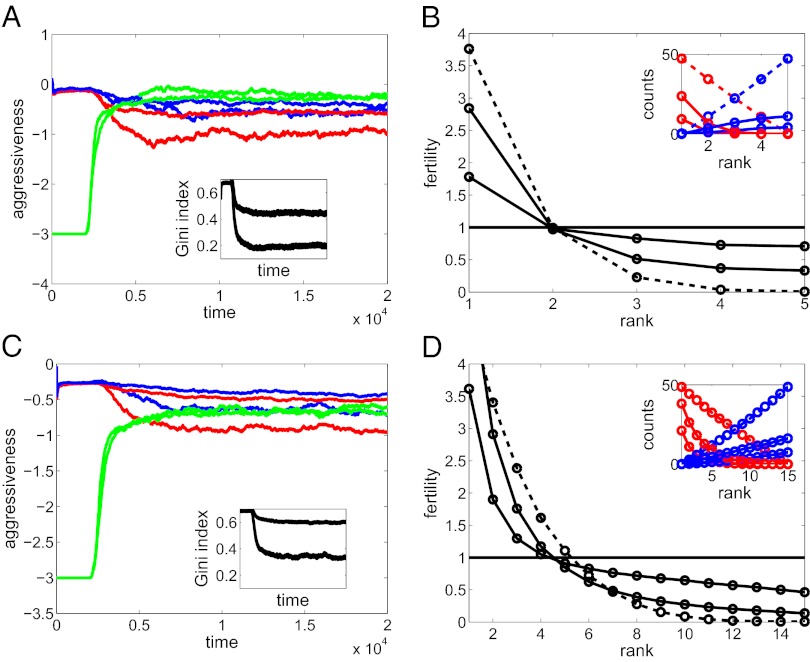
Fig. 2.
Evolutionary dynamics and their effects. (A and C) Escalation thresholds in the role of victim (blue), bully (red), and helper (green) on the logarithmic scale. (Insets) The Gini index of inequality. (B and D) Average fertility of males of different rank. (Insets) The average number of times each individual lost the resource to a bully (increasing blue curves) and took the resource from an owner (decreasing red curves). Two sets of curves are shown, corresponding to α = 2 (less helping and equality) and α = 3 (more helping and equality). For the first 2,000 generations the helper aggressiveness was fixed at −3 and no evolution of helping was allowed. The dashed lines in B and D show the corresponding curves at generation 2,000 and solid curves are computed for the final generation. n = 5 in A and B; n = 15 in C and D. Other parameters: c = 8, β = 4, γ = σe = 0.2, σv = 0.4.

