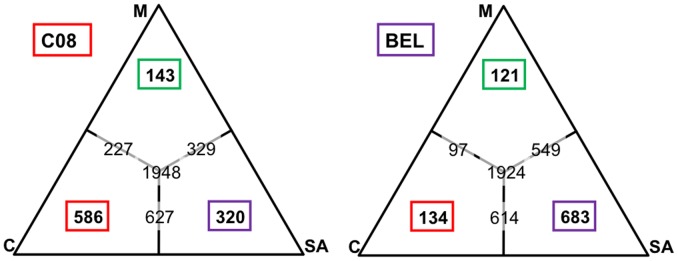
Figure 4. Allele sharing among P. vivax parasites.
The ternary plot shows the sample carrying the closest haplotype (i.e. the haploid sequence with the smallest number of nucleotide differences) to C08 (left) and Belem (right) for all annotated genes. The number in the red box indicates the number of genes for which the closest sequence is the C127 haplotype, while the green and purple boxes indicate the numbers of genes for which the closest sequence are, respectively, the M15 and Sal I haplotypes. The numbers of the edges represent genes for which two or more haplotypes are equally distant from the sample considered.

