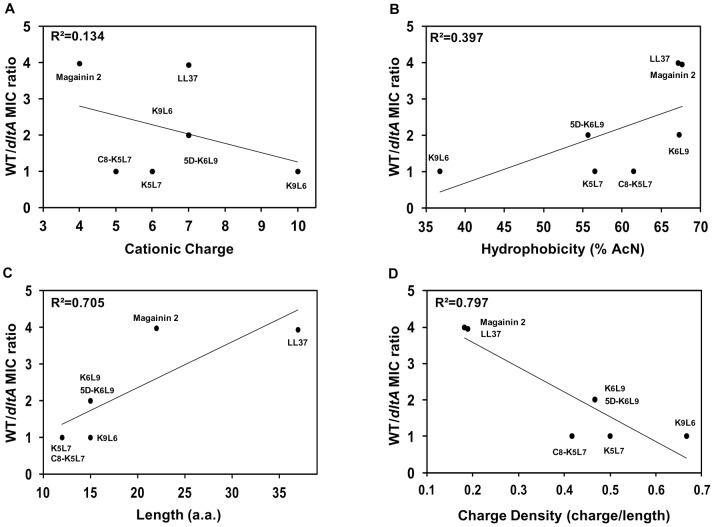
Figure 1. CAMPs activity against GBS strains versus peptide properties.
Charge (A), hydrophobicity (B), length (C), and charge density (D) were plotted versus the ratio between the MICs against the WT strain and the isogenic dltA mutant. The characteristics of each peptide are shown in Table 1.

