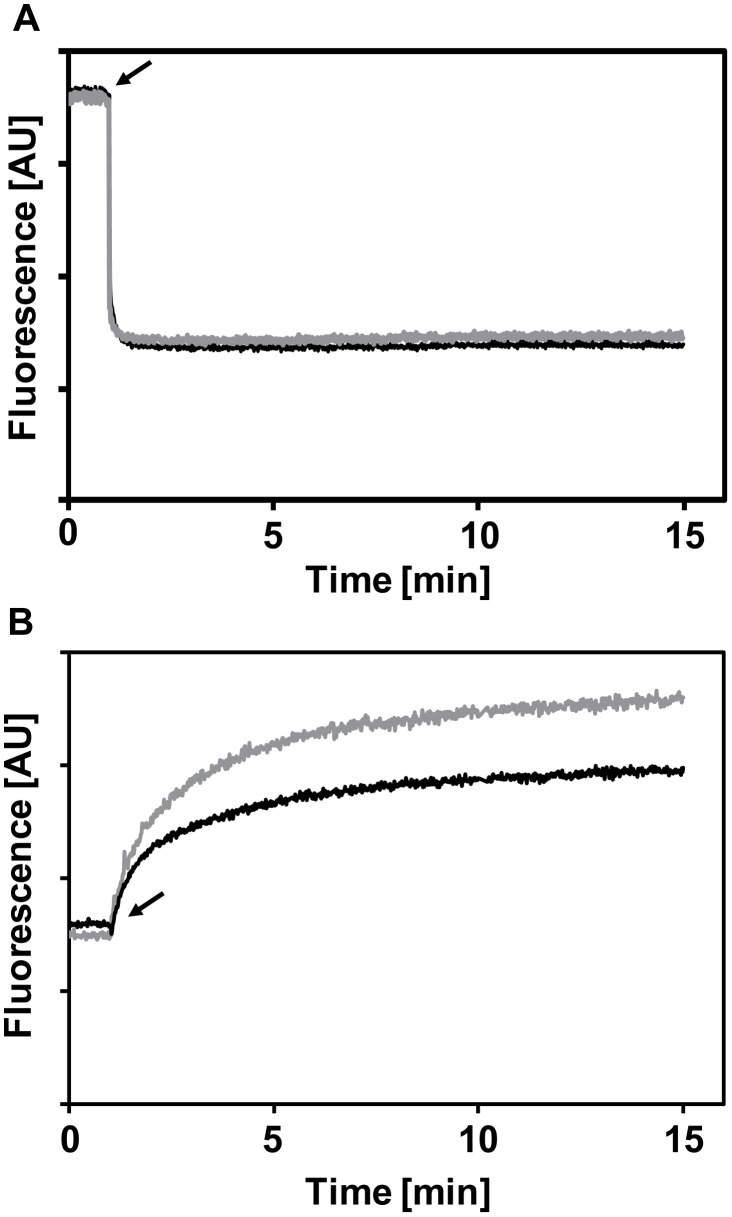
Figure 7. CAMPs aggregation and penetration through the cell wall.
Representative curves of the change in fluorescent signal of 1 µM rhodamine-labeled (A) or NBD-labeled LL37 (B), following addition of bacteria. WT and dltA mutant are represented by black and gray lines, respectively. The black arrow denotes the addition of bacteria.

