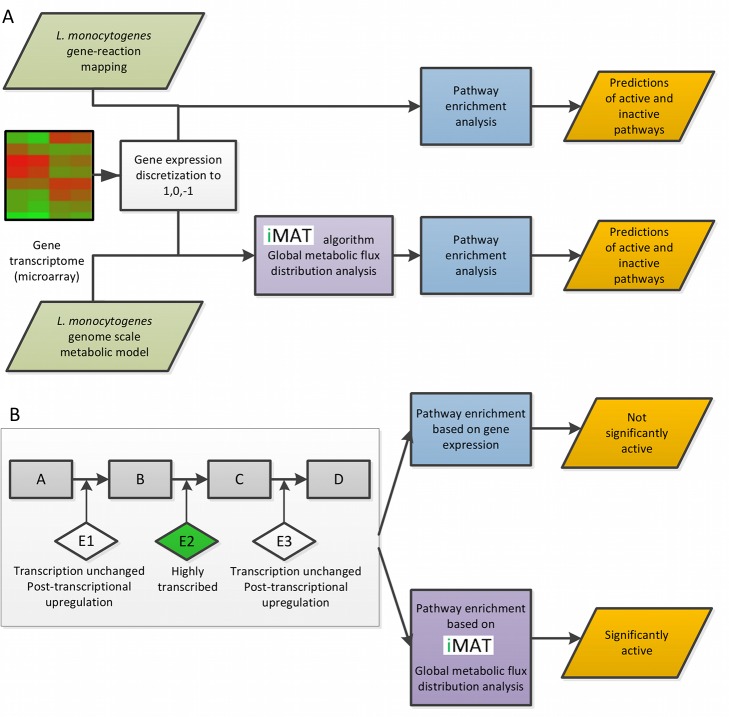
Figure 1. Workflow illustration.
A. A presentation of the study workflow, indicating the two methods of analysis that were used. B. An example of iMAT's ability to predict post-transcriptional regulation. This example represents a case of which only one of the three enzymes of a metabolic pathway is transcriptionally induced, while the other two are regulated post-transcriptionally. iMAT algorithm takes into a count the global metabolic fluxes according to the transcriptomic data and can correctly predict whether an entire pathway is up regulated, if it is in line with the flux distribution in the model. Rectangles represent metabolites, diamonds represent enzymes.

