
Figure 3. L. monocytogenes metabolic mutants grow less efficiently in macrophage cells.
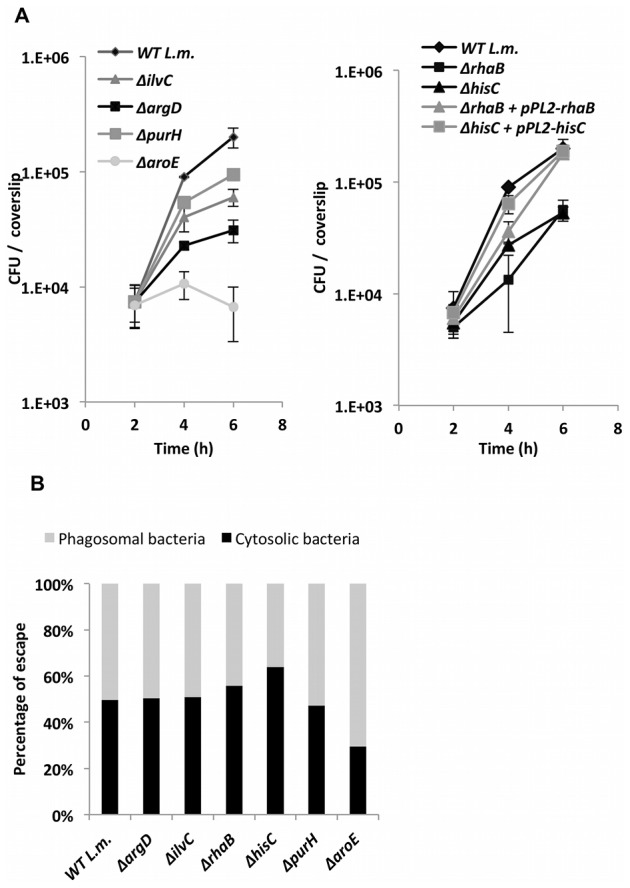
A. Intracellular growth curves of WT L. monocytogenes and metabolic mutants. Left panel: ΔilvC, ΔargD, ΔpurH, ΔaroE mutants (for complemented strains, see Figure S3). Right panel: the newly identified metabolic mutants ΔrhaB and ΔhisC, and complemented strains harboring a copy of rhaB and hisC genes on the pPL2 plasmid. The experiment was performed 3 times and representative growth curves are shown. Error bars indicate standard error. B. Percentage of bacteria that escaped macrophage phagosomes at 2.5 h.p.i. as determined by microscope fluorescence assays. The data represents 3 independent experiments (N = 3).