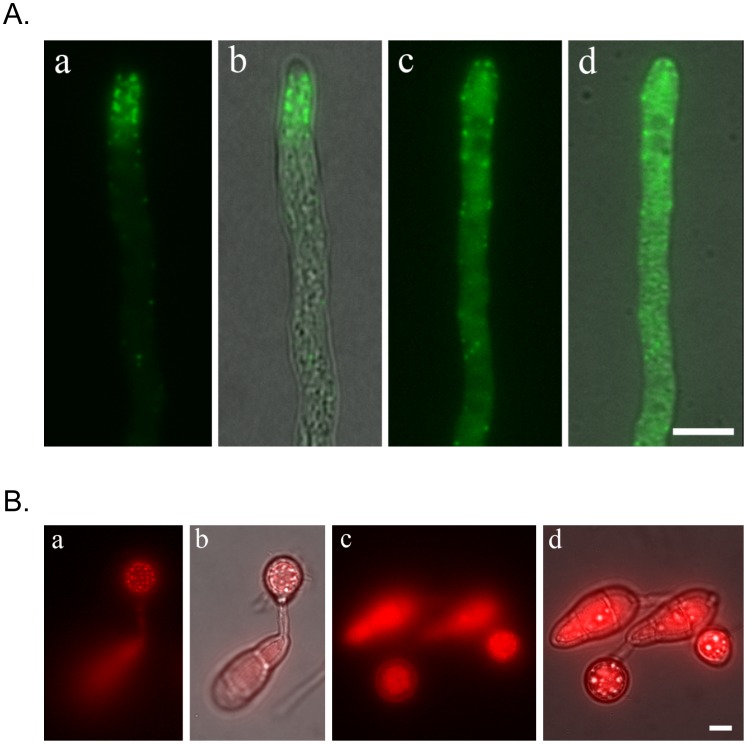
Figure 8. Cytochalasin A (CytA) treatment disrupted normal subcellular localization of Cap1 in vegetative hyphae (A) and during appressorium formation (B).
A. Hyphae of the CAP1-GFP transformant treated with (c and d) or without (a and b) CytA were examined by DIC and fluorescence microscopy. Panels a and c were GFP images. Panels b and d were composites of GFP and DIC images. B. Conidia harvested from the CAP1-RFP transformant were incubated on hydrophobic surfaces for 16 h and examined by DIC and fluorescence microscopy. Panels a and b were non-treatment controls. Panels c and d were samples treated with CytA for 15 min. before examination. Panels b and d were composites of GFP and DIC images. Bar = 5 µm.

