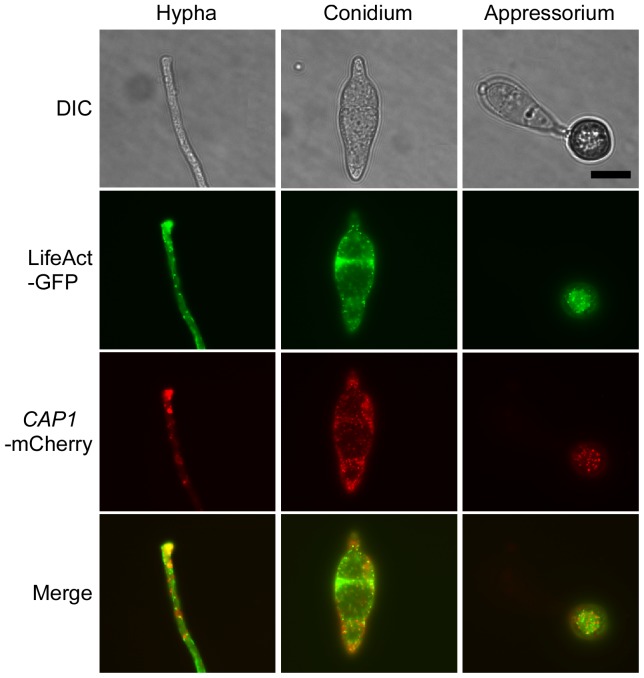
Figure 9. Assays for co-localization of LifeAct and Cap1.
Vegetative hyphae, conidia, and appressoria (16 h) of transformant MC20 expressing the LifeAct-GFP and CAP1-mCherry constructs were examined under DIC and epifluorescence microscopy with GFP and mCherry-specific filters. The bottom panel was generated by merging the GFP and mCherry images.

