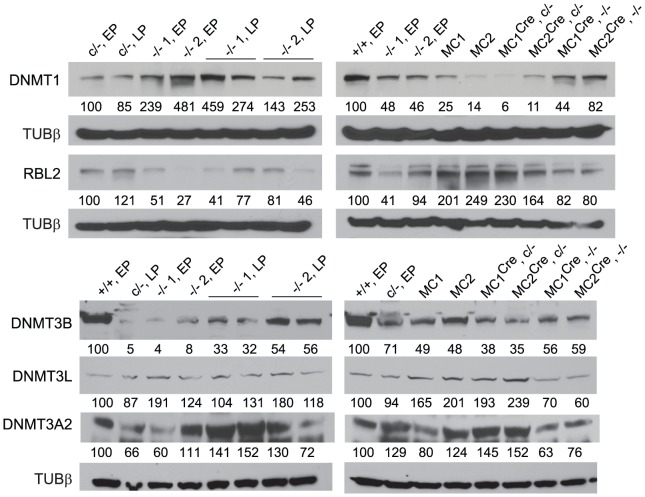
Figure 2. Immunoblots.
Values below each band represent the densitometry reading taken for that band. These were normalized to the reading taken for lane 1, which was for the WT Dicer1 +/+ EP cell line (+/+, EP), or the parental Dicer1 c/− EP cell line (c/−, EP). The loading was consistent throughout as shown by the detection of Tubulin β (TUBβ).

