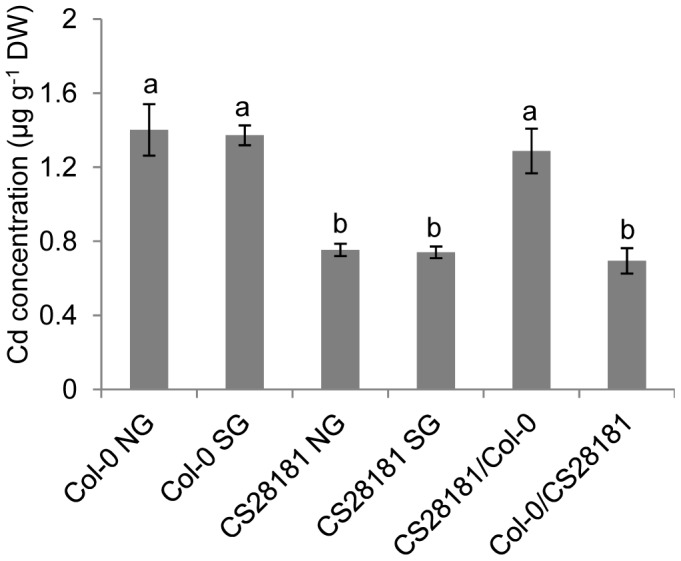
Figure 5. Reciprocal grafting determines that the low leaf Cd phenotype of CS28181 is driven by the root.

Bars represent the leaf Cd concentration of reciprocally grafted A. thaliana CS28181 and Col-0 accessions. NG = Non-grafted plants; SG = Self grafted plants; CS28181/Col-0 = CS28181 shoot grafted onto a Col-0 root; Col-0/CS28181 = Col-0 shoot grafted onto a CS28181 root. Data represent means of leaf Cd concentration ± standard errors (n = 5–14 independent plants per grafting type). Letters above bars indicate statistically different groups using a one-way ANOVA with groupings by Tukey's HSD using a 95% confidence interval.
