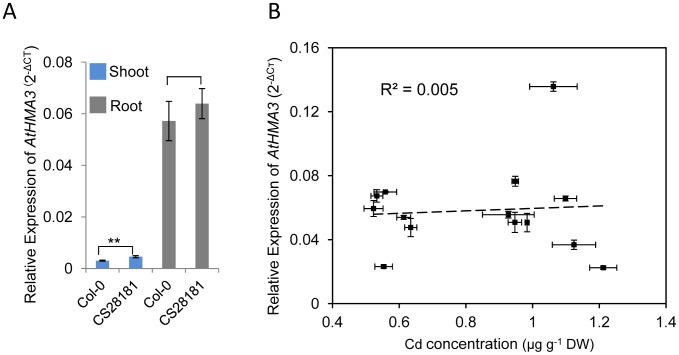
Figure 6. Quantification of expression of HMA3 in various A. thaliana accessions by quantitative real-time RT–PCR.
A. Expression of HMA3 in shoot and root of A. thaliana accession Col-0 and CS28181. B. Correlation between root expression of HMA3 and leaf Cd accumulation in 14 A. thaliana accessions. For the analysis UBC (AT5G25760) was used as an internal normalization standard across all samples. The expression of HMA3 was calculated as 2−ΔCT relative to UBC. Data represent means ± standard error (n = 4 independent biological replicates per accession and tissue).

