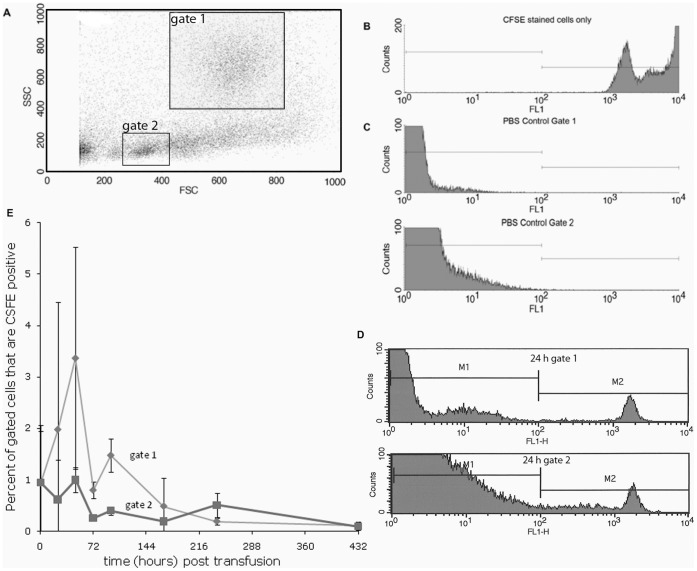
Figure 5. Flow cytometry data of CFSE stained leukocytes re-isolated from recipient rag1−/− mutant kidneys.
A. Scatter plot of kidney leukocytes demonstrating the gating of cell populations (gate 1 is phagocytes, gate 2 is lymphocyte like cells). B. Histogram of positive control: CFSE stained cells injected into the recipient. C. Histogram of negative control: cells isolated from a PBS injected fish. D. Histograms CSFE stained cell counts from gate 1 (phagocytes) and gate 2 (lymphocyte like) from kidney tissue of recipient rag1−/− mutants at 24 h post infusion. E. Graph indicating the CFSE stained cell counts in the kidney of transfused fish at 1 h, then 1, 2, 3, 4, 7 and 18 days post transfusion. Error bars indicate standard deviation (n = 2).

