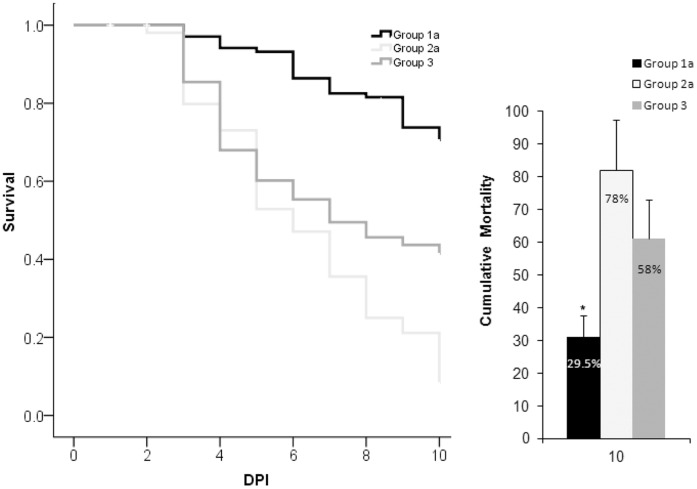
Figure 6. Comparison of survival by day (left panel) and cumulative mortality (right panel) in Adoptive Immunity Trial 5.
Asterisk indicates that recipients of vaccinated transferred kidney interstitial cells (Group 1a) had significantly lower (p<0.05) mortality than recipients of naïve transferred cells (Group 2a), or naïve fish injected with E. ictaluri (Group 3). DPI = days post injection of the secondary exposure. Error bars indicate standard deviation between tanks (n = 7).

