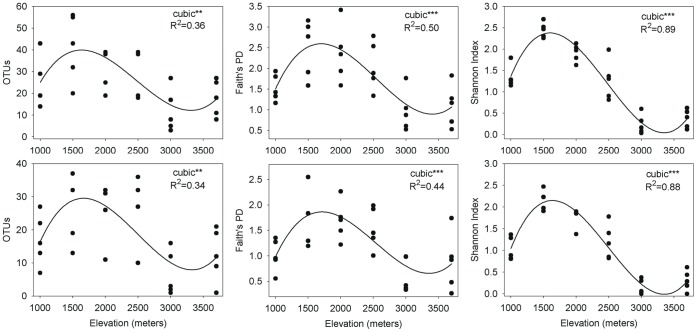
Figure 4. Relationship between elevation and phylotype richness (left), phylogenetic diversity (middle), phylotype diversity (right) in the whole community (first row) and Thaumarchaeota (second row).
We tested three models (linear, quadratic, and cubic) to describe the relationships and model selection was carried out based on adjusted R2 and RMSE (root mean square error; value not shown). Significance level is shown with ***P<0.001; **P<0.01; and P<0.05.

