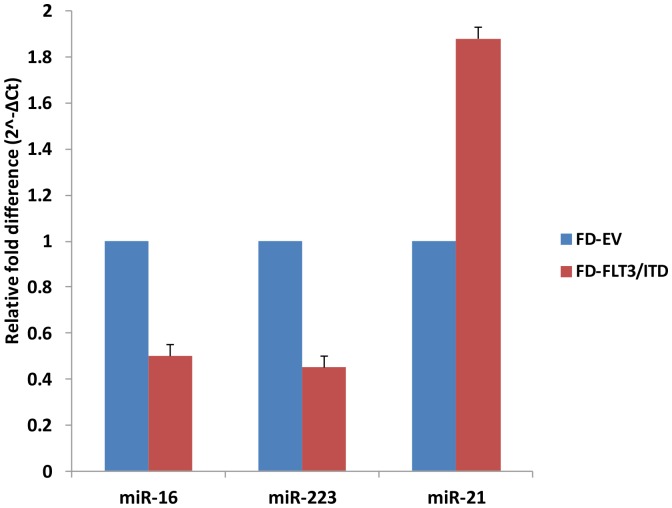
Figure 3. Quantatative RT-PCR validates microarray data.
The three miRNAs (miR-16, miR-223, and miR-21) selected from Fig. 2 were analysed by QPCR on total RNA from FD-FLT3/ITD cells. We first obtained ΔCt (gene Ct – U6 Ct) from Ct values of each gene for normalization and then ΔCt values were converted to relative gene expression using the 2−ΔCt method. The graph is presented to show relevant gene expression fold differences in FD-FLT3/ITD cells compared to empty vector expressing control FD-EV cells (fold = 1). The results show the mean and standard deviation for triplicate QPCR results from three independent experiments (p<0.01).

