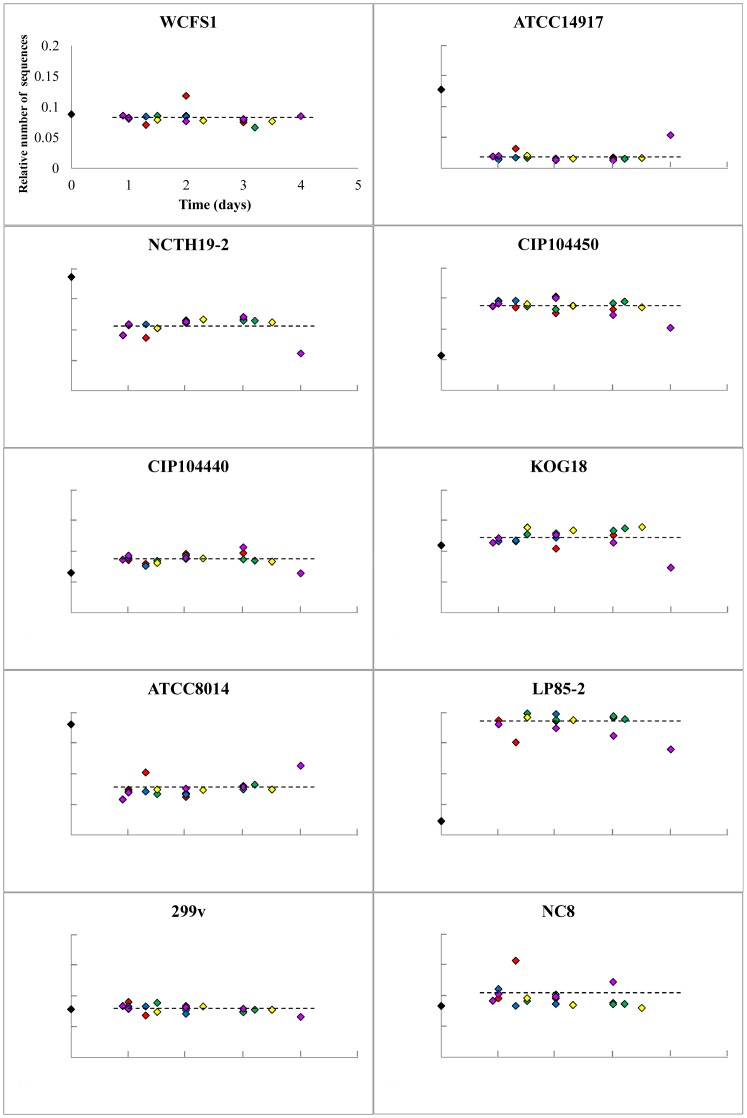
Figure 4. Strain-specificL. plantarum relative abundance after human consumption as detected by pyrosequencing.
Relative strain abundances of the bacterial preparations consumed by the volunteers are depicted in black diamonds and those determined in time-specified post-consumption fecal material from the subjects 1 to 5 in red, green, blue, purple, and yellow diamonds, respectively. The graphs represent the number of strain specific sequences in the amplicons generated from DNA derived from fecal samples, divided by the number of strain-specific sequences identified in the input mixture amplicon. The total number of sequences per sample was set at 1 for normalization purposes. Axis-scaling in all the graphs is the same as depicted for strain WCFS1.

