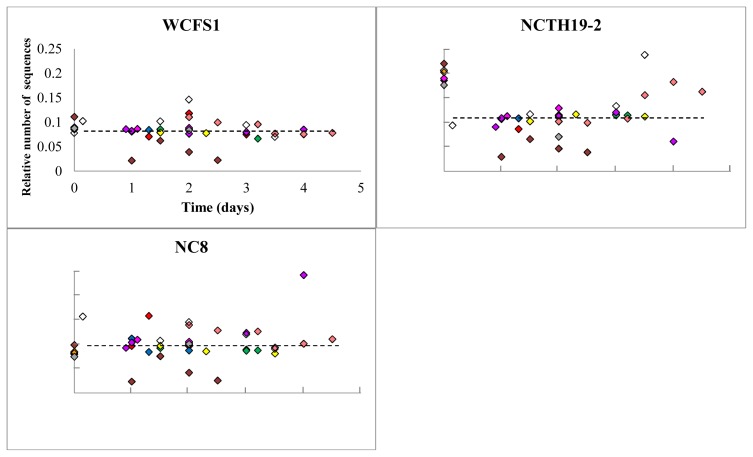
Figure 5. L. plantarum strain WCFS1, NCTH19-2, and NC8 relative abundance after human consumption as assessed by pyrosequencing.
Relative strain abundances from subjects 1 to 10 are depicted in red, green, blue, purple, yellow, pink, brown, orange, white and grey diamonds, respectively. The graphs represent the number of strain specific sequences in the fecal amplicons, divided by the number of strain-specific sequences identified in the input mixture amplicon. The total number of sequences per sample was set at 1 for normalization purposes. Axis-scaling in all the graphs is the same as depicted for strain WCFS1.

