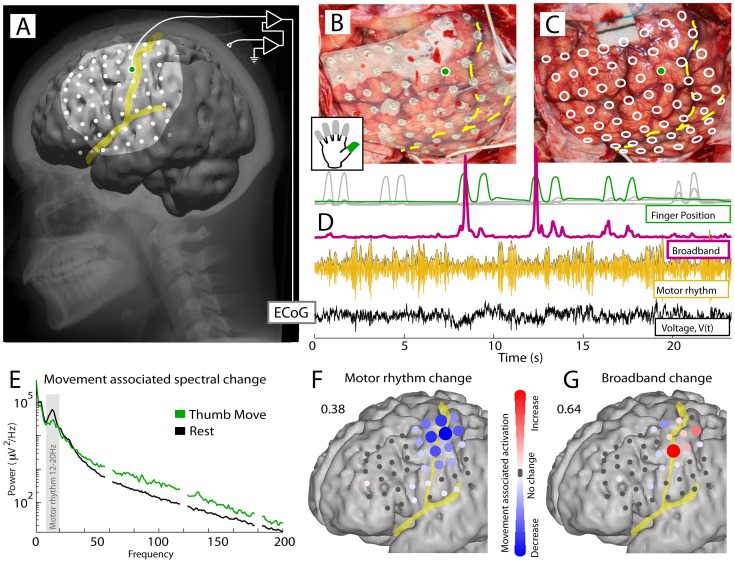
Figure 1. Electrocorticographic (ECoG) activity in rolandic cortex during movement and rest (Subject 1).
(A) ECoG potential is measured from the brain surface. (B) ECoG electrodes in situ, embedded in silastic. (C) Electrode positions on the cortical surface. (D) Traces show simultaneous finger position color-coded as in inset (top) along with aspects of the potential timeseries. The raw ECoG voltage at bottom (black) is shown from the M1 site marked with green dot in A–C. “Motor rhythm” is 12–20 Hz bandpassed ECoG (gold trace). “Broadband spectral change” (pink) is the timeseries of an estimate of the coefficient  in a power law in the power spectral density of the form
  . (E) The power spectral density during movement (green) and rest (black) reveals a decrease in a peaked process at low frequencies (gray – 12–20 Hz), and a broadband increase across the rest of the frequency range during movement (60 Hz line noise and harmonics omitted). (F) The spatial distribution of sites showing a decrease in 12–20 Hz power associated with thumb movement. (color represents a signed r2 measurement, scaled to the maximum across the array: 0.38). In these figures the Central sulcus and Sylvian fissure are shown in yellow. (G) Broadband spectral changes associated with thumb movement are similarly shown (maximum: 0.64).

