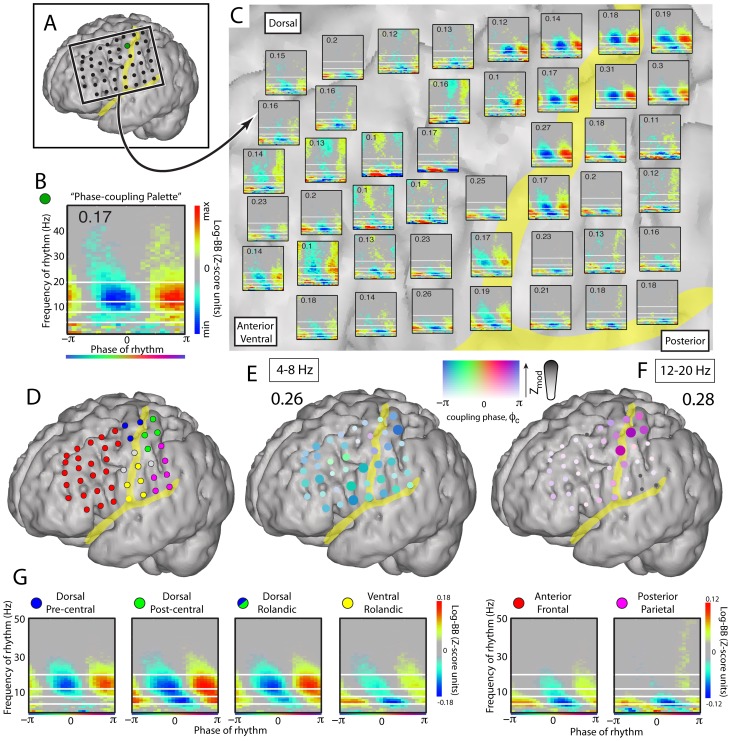
Figure 6. Phase coupling at the lateral cortical surface during baseline fixation task (subject 1).
(A) Data were obtained from grid of electrodes on the lateral cortical surface. (B) The phase coupling palette for the green site in (A). Inset number (0.17) denotes maximum scaling. White lines identify 4, 8, 12, 20 Hz. (C) Phase coupling palettes for each cortical site on the grid region in (A), with white lines and scaling maxima noted as in (B). (D) Colors of electrode sites delineate cortical regions for average phase palettes in (G). (E) 4–8 Hz modulation in the grid using the band-pass & Hilbert transform. The strength of color and diameter denote the magnitude of coupling, and the color denotes the preferred phase of coupling. Note that coupling to the theta range is quite widespread. (F) Distribution of 12–20 Hz modulation, as in (E). Note that the modulation is strongest in dorsal peri-central areas. (G) Average phase palette by cortical regions delineated in D. The “Dorsal Rolandic” palette combines Dorsal Pre- and Post- central cortex.

