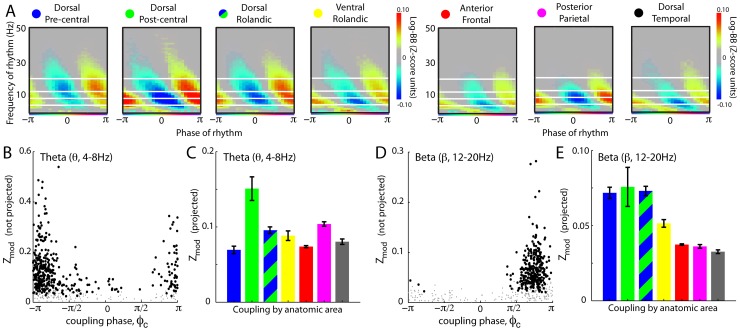
Figure 7. Pooled phase coupling at the lateral cortical surface during baseline fixation task, (subjects 1–4, 7–12).
(A) Average palette by region, across all subjects. (B) Coupling in the 4–8 Hz range. Each dot is an electrode. Black denotes statistically significant coupling. Gray is not significant. (C) Average coupling to 4–8 Hz range across all electrodes in each region (color code of bars indicate areas identified in A. Error bars are 95th percentiles obtained by repeated vector projection of only half of electrodes, randomly selected each time). (D and E) As in B and C, but for 12–20 Hz.

