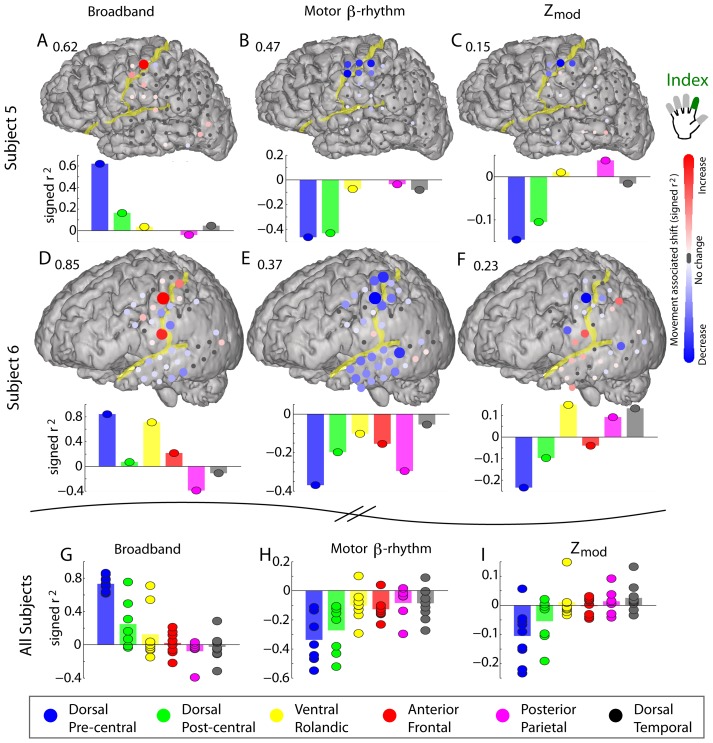
Figure 9. Movement associated shift in rhythmic modulation of local cortical activity for different cortical areas.
(A) The spatial distribution of shift in broadband magnitude during index movement compared with rest (a signed r2 measurement – maximum scaling denoted by the number above the cortical rendering). The bars below denote the maximum signed-r2 increase/decrease in each region (Subject 5). (B) As in A, but for the shift analytic amplitude of the 12–20 Hz filtered voltage (β-rhythm). (C) The shift in the modulation of broadband spectral change with the phase of the 12–20 Hz phase – the signed-r2 between the index finger movement epoch and rest epoch projected distributions, as illustrated in Figure 5I&J. (D–F) As in A–C, but for Subject 6. (G) Maximum signed-r2 increase/decrease in broadband spectral change during index finger movement compared with rest, for each region separately for all subjects. Note that the effect is strong and specific to dorsal pre-central gyrus. The bar denotes the average, and each dot denotes a different subject (subjects 1–9). (H) As in G, but for the shift analytic amplitude of the 12–20 Hz filtered voltage (β-rhythm). (I) As in G, but for the shift in the modulation of broadband spectral change by the phase of the 12–20 Hz rhythm.

