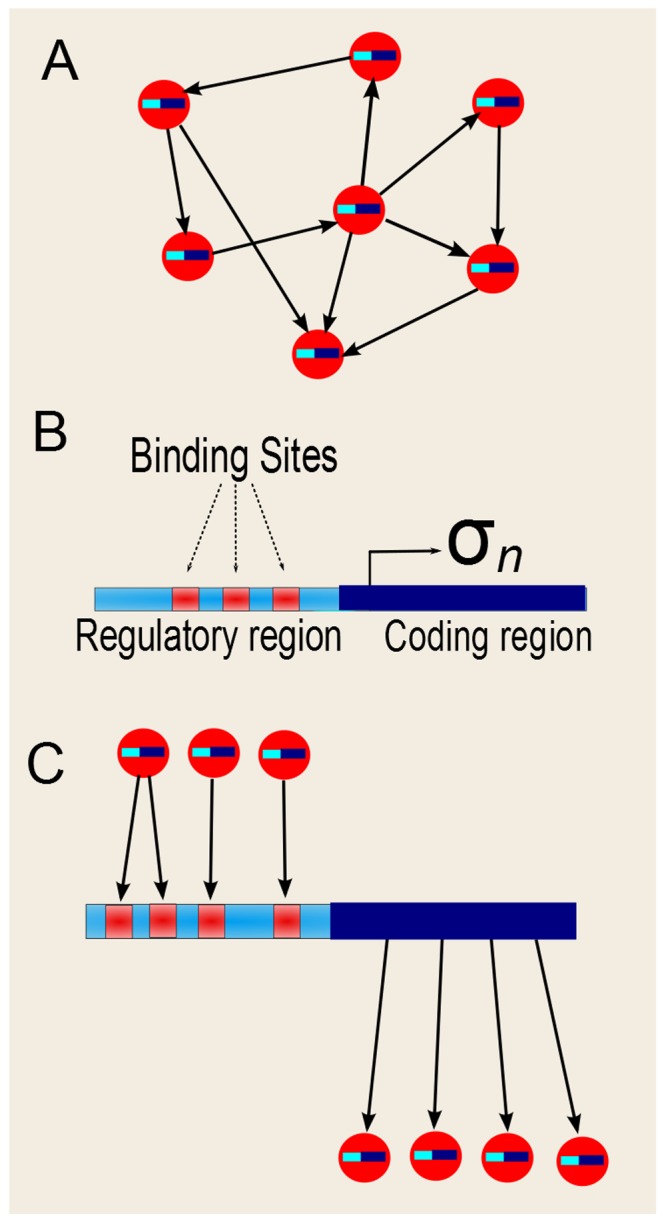
Figure 1. Gene structure.

(A) Schematic representation of the network, showing that each node (circles) “contains” one gene (little bars inside the circles). The arrows represent the regulatory interactions between the genes. (B) Each gene  is composed of a regulatory region and a coding region. The regulatory region contains binding sites which can be added to, or removed from, the regulatory region with the same probability. (C) The binding sites in the regulatory region determine the regulators of
  (its input connections). There can be more than one binding site per regulator (as the regulator on the very left), although at the beginning of the evolutionary process the initial networks have only one binding site per regulator. The regulatory region of
  determines which other genes it regulates.
