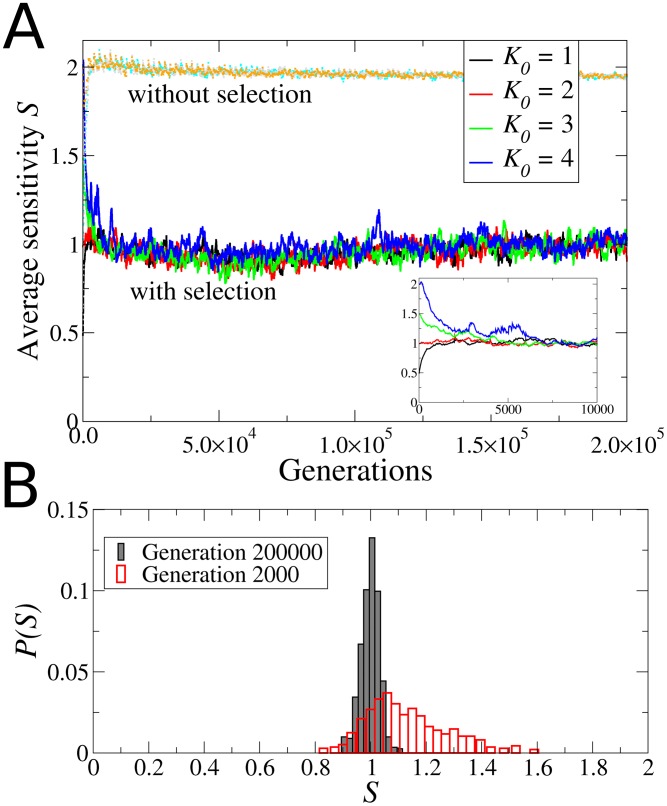
Figure 3. Evolution towards criticality.
(A) Evolution of the average network sensitivity for four different populations, each initially composed of networks in one of the three dynamical regimes: ordered ( , black), critical (
 , red), and chaotic (
 , green; and
  , blue). Under the Darwinian selection given by the ACC and AIC, all the populations quickly become critical (
 ), regardless of their initial dynamical regime. The inset shows that convergence towards criticality occurs during the first 10000 generation steps. The control curves (in light gray) were obtained by evolving populations without selection, and show that the mutagenic method alone drives the networks into the chaotic regime (
 ). (B) Distribution of sensitivities at two different generations for the population that started with
  chaotic networks. In early generations
  is quite broad (dashed line), reflecting a great diversity of networks. However, through evolution all the surviving networks approach criticality and the distribution
  narrows down (solid line). The distribution shown here at generation
  has
has  .
.

