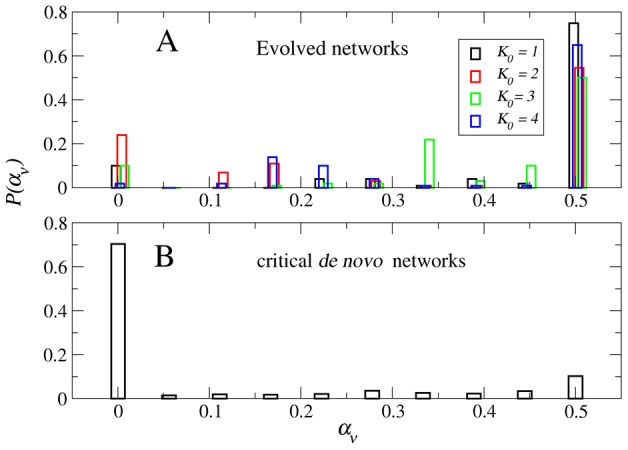
Figure 4. Genetic variability in the attractors.

(A) Histogram  of the vertical genetic variability
  in the attractors of the evolved networks. Note that most of the genetic variability is concentrated around
  , which indicates that most of the genes in the attractors of the evolved networks switch back and forth between 0 and 1 throughout time. There are almost no frozen genes in these attractors (
 is relatively small). (B) Histogram of the vertical variability in the attractors of de novo critical networks that were constructed to be critical by design and did not go through the evolutionary process. Note that in this case most of the genes are frozen in time, as the largest peak at
  indicates.
