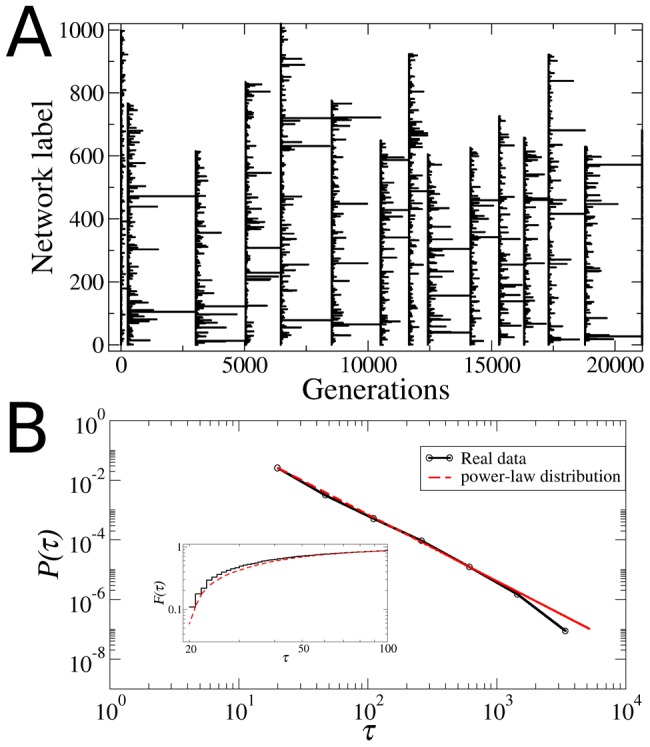
Figure 5. Survival times of the different strains in the population.

(A) Plot of the network labels (strains) that are present in the population at a given generation. Each horizontal line indicates the survival time of a particular strain. The vertical lines indicate the fixation events in which all the networks in the population are relabeled after only one strain was left in the entire population. (B) Distribution  of survival times computed during
  generations (black curve). This distribution was computed using logarithmic bins. Only data for
  are presented because we checked the existence of strains every 20 generations. The red dashed line is the best fit which corresponds to the power-law
  . The inset shows the corresponding cumulative distribution
  , which better reveals the goodness of the power-law fit. The fact that
  has a more or less power-law behavior implies that almost all the strains disappear from the population very quickly, whereas only very few networks are able to survive the Darwinian selection mechanism given by the ACC, the AIC and the α-fitness criterion.
