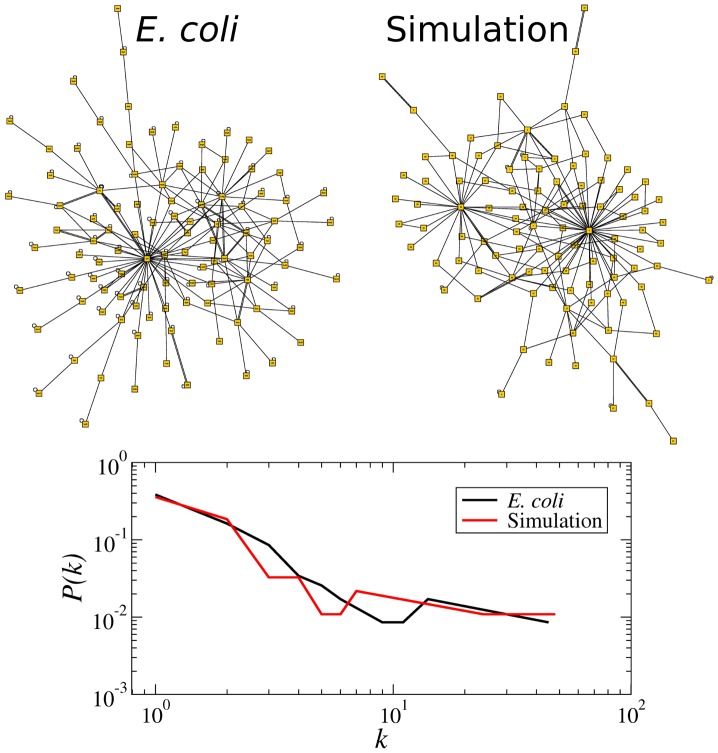
Figure 6. Network structure generated by the evolutionary process.
The top-left network shows the structure of the giant component of the transcription factor interaction network of E. coli according to the RegulonDB [3]. This network has N = 101 nodes and average connectivity K = 2.46. The structure on the top-right corresponds to the typical network that results from our evolutionary algorithm, which in this particular case has N = 100 nodes and average connectivity K = 1.85. Note the existence of global regulators, i.e. nodes with a great number of output connections. The bottom panel presents in a log-log plot the out-degree distribution of these two networks to illustrate their remarkable similarity.

