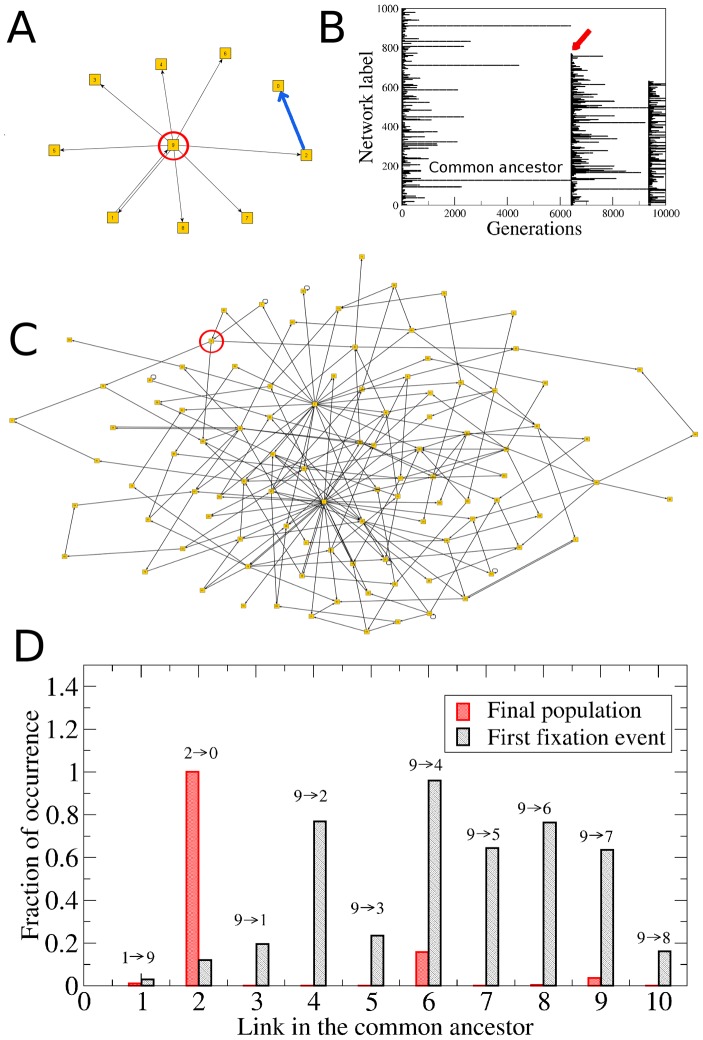
Figure 8. Evolution of the network topology.
(A) The common ancestor network has 10 nodes and one of them (node number 9) is a global regulator that regulates 8 other nodes. (B) Diagram of strain survival times showing the first fixation event at generation g = 6411 (indicated by the red arrow). The common ancestor network is the one that gives rise to the population of the first fixation event. (C) Structure of a randomly chosen network in the final population (generation g = 250000). The initial hub (node number 9) is the one marked with the red circle. Note that at the end this is not a hub anymore, but just another ordinary node of the network. (D) Distribution of the link persistence  for the 10 connections
  of the common ancestor. The black and red histograms represent the populations at the first fixation event and at the end of the simulation, respectively. Even after the first fixation event, the links
  ,
,  and
and  almost disappear from the population. Furthermore, in the final population none of the links of the initial hub occur at significant frequency. By contrast, link
  is present in all the networks of the final population because node 2 became a hub throughout the evolutionary processes. Link
  is indicated with the blue bold arrow in (A).

