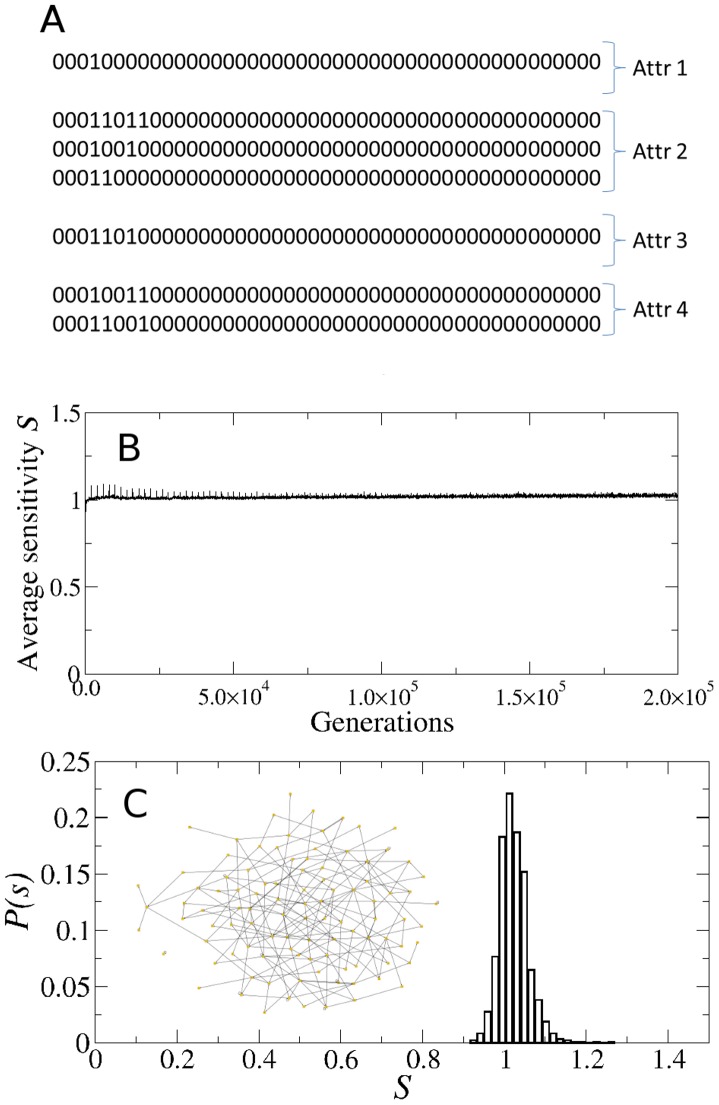
Figure 9. Importance of the gene expression variability as a fitness criterion.
(A) Typical example of the attractors obtained when the evolution of the population is carried out without implementing the  -fitness criterion. In this particular case, instead of the
  -fitness we used the S-fitness which assigns a higher replication rate to the networks whose sensitivity is closer to 1. The final attractor landscape consisted of 91 attractors, and only 4 are partially shown here (only the first 45 digits in each attractor state are shown; the remaining 55 digits are all 0's). Note that only the first 10 digits in each attractor state show some activity. There are the 10 genes in the networks of the original population. (B) Plot of the average sensitivity of the population throughout generations, showing that the sensitivity very quickly approaches 1 and remains very close to 1. This is expected since we are explicitly selecting for networks with sensitivities
  . (C) Histogram of sensitivities in the final population (generation g = 200000), showing that most networks in the final population have become critical. The inset shows the structure of a typical network in the final population. Note that this network exhibits a more homogeneous random topology with no hubs. This is always the case when
  -fitness is not used as selection criterion.

