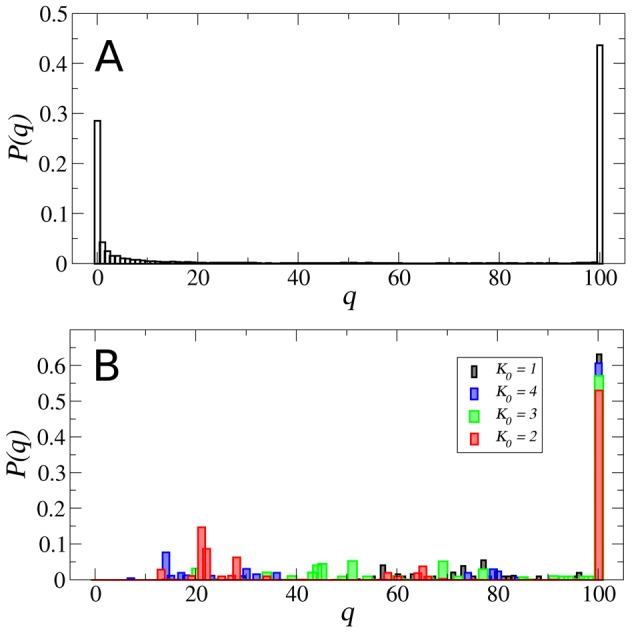
Figure 10. Robustness of the attractor landscape.

Plots of the probability  that a percentage q of the network attractors is conserved after a gene the knockout of one gene for critical networks constructed de novo (A) and the critical networks that result from the evolutionary process (B). The differently colored distributions in B correspond to populations that started in different dynamical regimes (as in Fig. 1). Note the high probability for the de novo networks to lose all their attractors by a gene knockout (
 ) which does not happen for the evolved networks (
 in all cases). Conversely the probability to conserve all attractors is considerably larger for the latter than for the former (
 and,
and,  respectively). These data were computed from populations of 1000 networks and 500 attractors per network.
