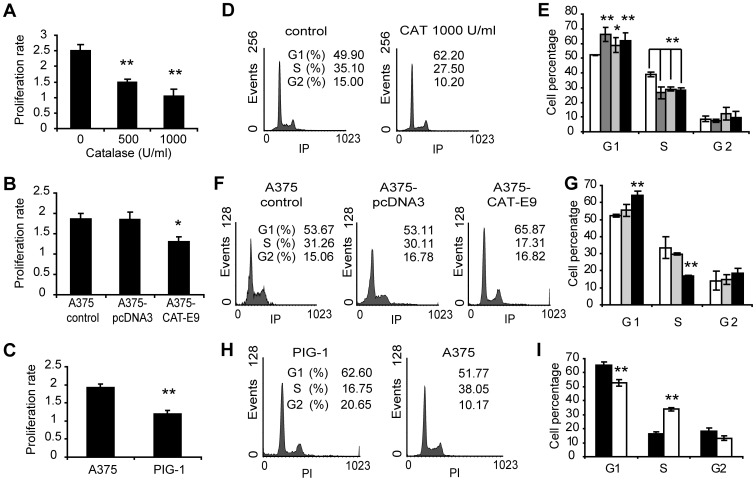
Figure 2. Decreased cell proliferation rate and cell cycle arrest in response to lowered levels of ROS.
(A) Cell proliferation rate of melanoma cells treated with catalase for 24 h, relative to control cells, evaluated by the MTT assay. Data are expressed as mean ± SD. **p<0.01 vs. control. (B) Proliferation rate in A375-CAT-E9, A375-pcDNA3 and A375 control cells. Data are expressed as mean ± SD. *p<0.05 vs. A375 control. (C) Proliferation rate of non-tumor (PIG-1) and tumor (A375) cells. Data are expressed as mean ± SD. **p<0.01 vs. A375. (D–I) Cell cycle analysis assessed by flow cytometry after staining with propidium iodide. (D) Representative histograms of DNA content of A375 melanoma cells treated with 1000 U/ml catalase (CAT) during 24 h and A375 control cells. (E) Percentage of melanoma cells in the different phases of the cell cycle in response to CAT treatment. FBS starved cells were used as control of G1 arrest. (□) Untreated control cells, ( ) 500 U/ml and (■) 1000 U/ml CAT and (
 ) FBS starved cells. Data are expressed as mean ± SD. *p<0.05 and **p<0.01 vs. untreated control. (F) Representative histograms of DNA content of A375-CAT-E9, A375-pcDNA3 and A375 control cells. (G) Percentage of A375-CAT-E9 (■), A375-pcDNA3 (
 ) and A375 control cells (□) in the different phases of the cell cycle. Data are expressed as mean ± SD. **p<0.01 vs. A375 control. (H) Representative histograms of DNA content of PIG-1 melanocytes and A375 melanoma cells. (I) Percentage of (■) non-tumor (PIG-1) and (□) tumor (A375) cells in the different phases of the cell cycle. Data are expressed as mean ± SD. **p<0.01 vs. PIG-1 cells.

