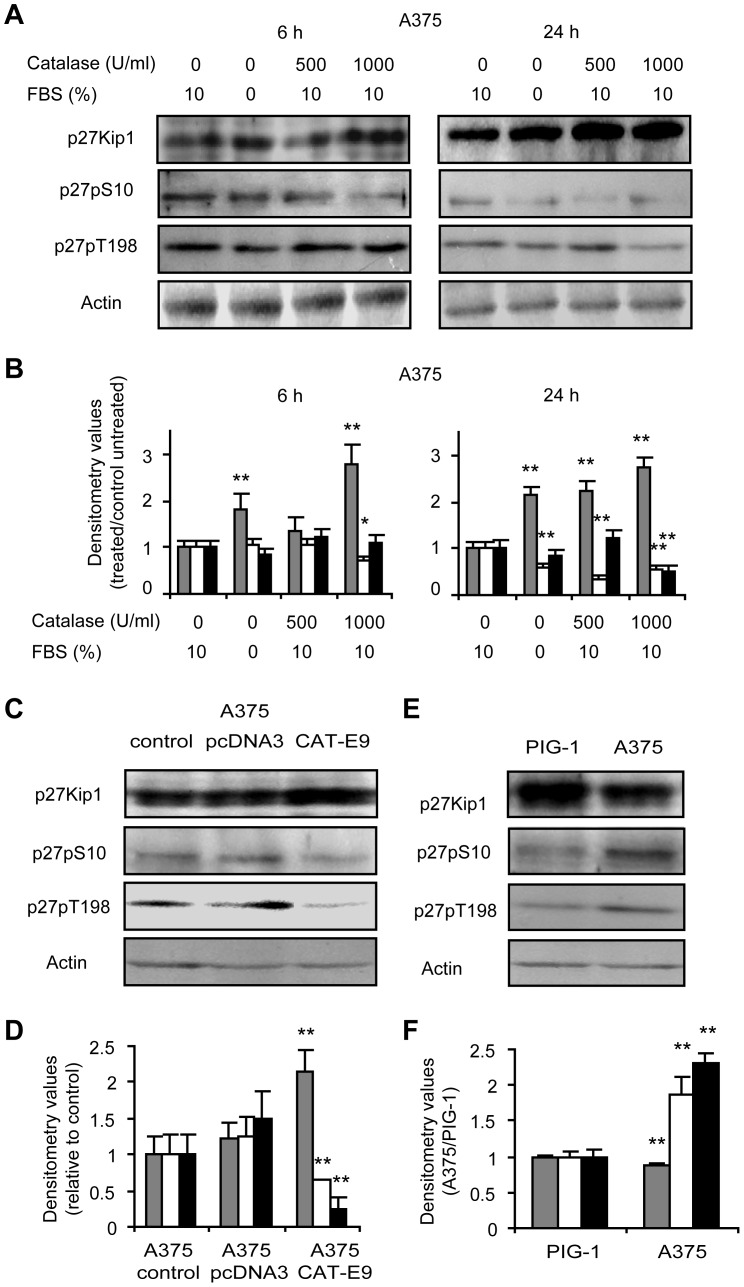
Figure 4. Increased p27Kip1 and decreased phosphorylated p27Kip1 at S10 and T198 by lowering H2O2 levels.
The expression of p27Kip1 and p27Kip1 phosphorylated at S10 (p27pS10) and T198 (p27pT198) was analyzed by western blot. (A–B) A375 melanoma cells treated with catalase (CAT) for 6 and 24 h. FBS starved cells were used as control of G1 arrest. (C–D) Catalase overexpression model (A375-CAT-E9 cells) vs. controls (A375-pcDNA3 and A375 control cells). (E–F) Non-tumor (PIG-1) vs. tumor (A375) cells. (A, C and E) Representative immunoblot images. (B, D and F) Relative densitometric values of ( ) p27Kip1 levels, (□) p27pS10 and (■) p27pT198. Actin densitometric values were used to standardize for protein loading. Results are referred to control without treatment (in B and D) and to non-tumor (PIG-1) cells (in F). Data are expressed as mean ± SD. (B) *p<0.05 and **p<0.01 vs. untreated control. (D) **p<0.01 vs. A375 control. (F) **p<0.01 vs. non-tumor cells.

