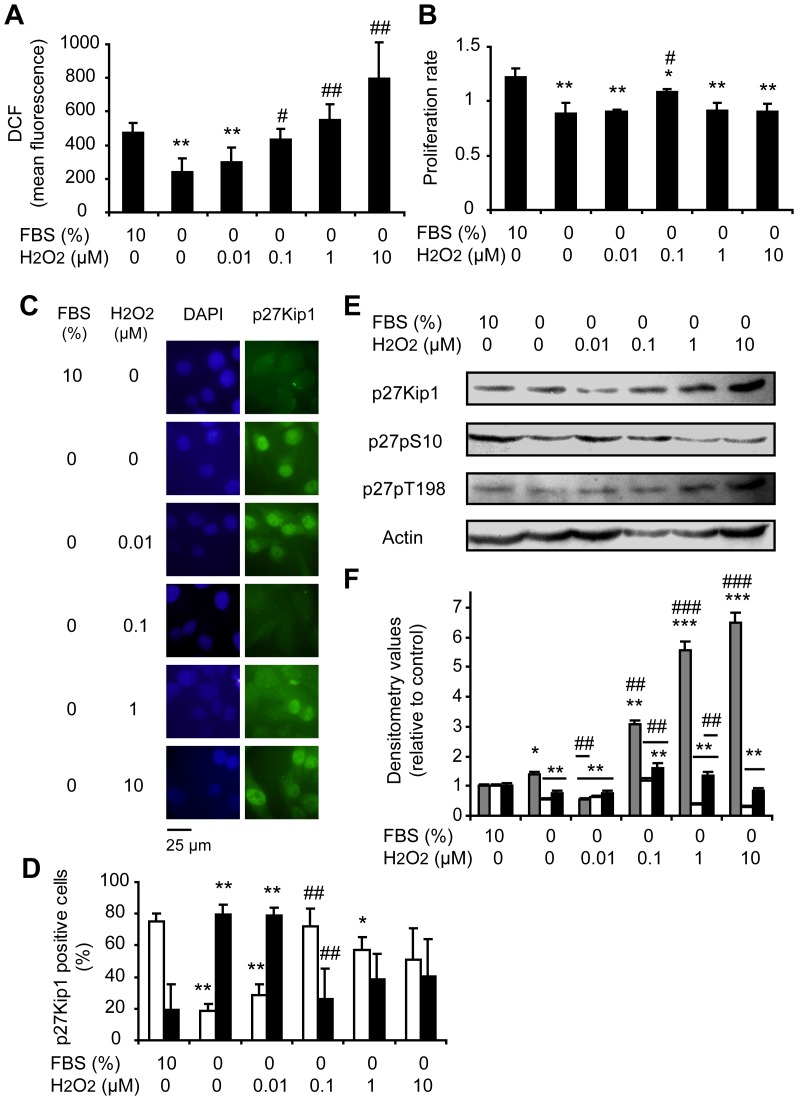
Figure 5. Adding 0.1 µM H2O2 to FBS starved cells regulates p27Kip1 phosphorylation and localization, favoring proliferation.
Melanoma (A375) cells grown in complete medium with 10% FBS were arrested by FBS starvation (0% FBS) for a period of 24 h and then cells were incubated with different concentrations of H2O2 (0.01–10 µM) or to 10% FBS. (A) Intracellular ROS levels measured by DCFH-DA assay. (B) Cell proliferation rate evaluated by the MTT assay. (C) Representative images of p27Kip1 immunocytofluorescence showing the subcellular localization of the protein. DAPI: staining of nuclear DNA; p27Kip1: FITC staining of p27Kip1 protein. (D) Percentage of positive (□) cytoplasms and positive (■) nuclei for p27Kip1 relative to the total number of counted cells. (E) The expression of p27Kip1, p27pS10 and p27pT198 analyzed by western blot. (F) Relative densitometric values of ( ) p27Kip1 levels, (□) p27pS10 and (■) p27pT198. Actin densitometric values were used to standardize for protein loading. Results are referred to control incubated with 10% FBS. (A, B, D and F) Data are expressed as mean ± SD. *p<0.05, **p<0.01 and ***p<0.001 vs. cells incubated with 10% FBS; #p<0.05, ##p<0.01 and ###p<0.001 vs. FBS-starved cells not-exposed to H2O2.

