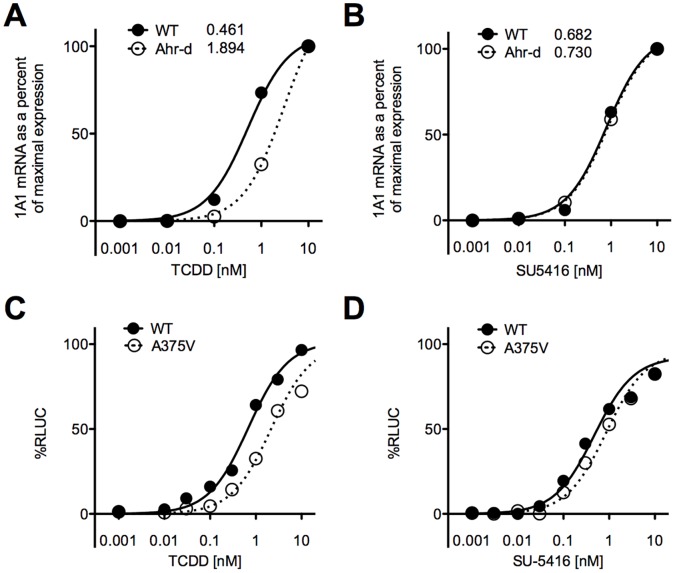
Figure 4. Splenocytes from wild-type and AHRd mice analyzed by qPCR for CYP1A1.
Spleens from these mice were harvested and suspended in culture media, and exposed to titrating doses of A) TCDD B) SU5416. After 4 hours they were analyzed by qPCR for CYP1A1 analysis. The curves are normalized from 0 to 100% response. Each graph is representative of 3 independent experiments. C–D. Cells transfected with AHR containing a valine point-mutation show similar ED50 to Cos-1 cells with AHRb isoform. Cos-1 cells were transfected with an AHR containing the same point mutation (valine for alanine) thought to be responsible for the low affinity of the AHRd isoform compared to AHRb, and compared to the wild-type AHR response. These cells also harbor a luciferase gene next to the DRE. C. Cos-1 cells were exposed to TCDD. D. Cos-1 cells were exposed to SU5416. The graphs represent normalized data from 0 response to 100% response. They are representative of 2 independent experiments.

