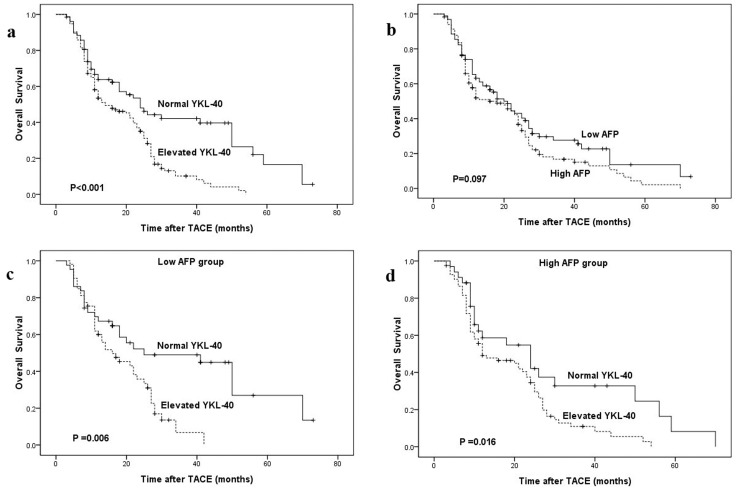
Figure 1. Kaplan-Meier survival curves stratified by serum YKL-40 and AFP.
a OS curve classified by YKL-40 in all patients (n = 212). b OS curve classified by AFP in all patients (n = 212). c OS curve classified by YKL-40 in low AFP group (n = 96). d OS curve classified by YKL-40 in high AFP group (n = 116).

