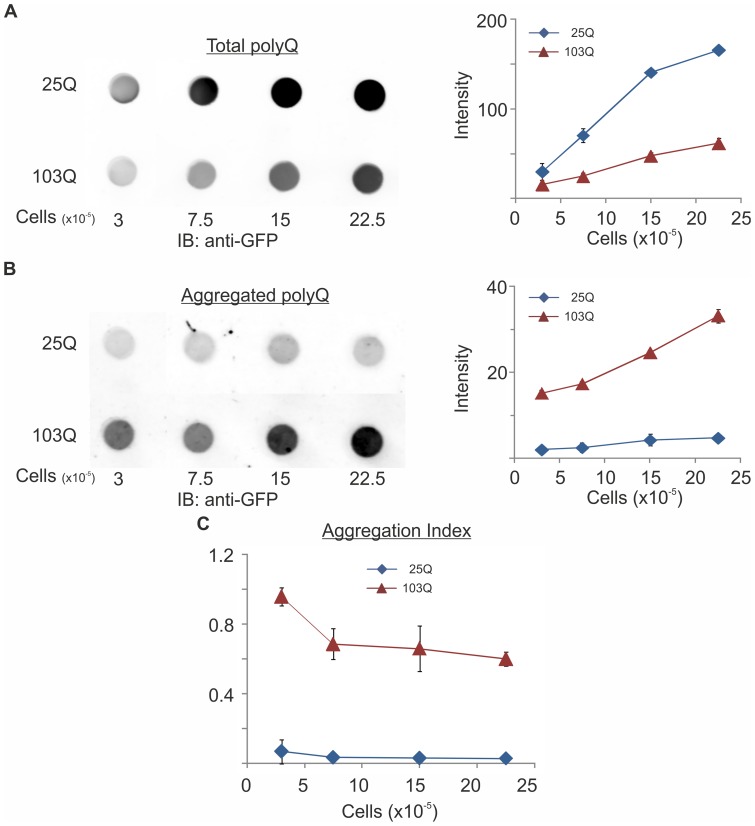
Figure 2. Quantitative filter retardation assay for polyQ proteins aggregates.
Wild-type cells (KFY100) expressing 25Q or 103Q were grown for 3 days under galactose induction. Cells were lysed and lysates from the indicated number of cells were A adsorbed onto untreated nitrocellulose to estimate the total amount of polyQ proteins, or B SDS was added and lysates were filtered through SDS-soaked membranes to capture polyQ aggregates. On both membranes, polyQ proteins were quantified by immunoblotting (IB) with a rabbit anti-GFP antibody followed by Dylight 680-labeled goat anti-rabbit IgG and visualized (only one set of transformants is presented) and quantified by the Odyssey Infrared Imaging System. C Aggregation Index (in arbitrary units) was calculated as the ratio between the filtered (panel B) and absorbed (panel A) polyQ proteins. Data from 3 independent transformants are presented as mean ± SE.

