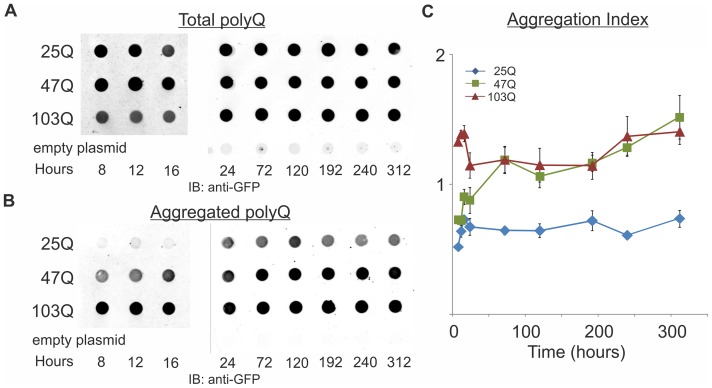
Figure 3. Quantitative retardation assay reveals that aggregation of 47Q increases upon aging.
Wild-type cells (W303–1b) expressing 25Q, 47Q or 103Q were grown under galactose induction for the indicated time, and at each time point 11.25×10⁵ cells (within the linear range; see Figure 2) were lysed. Early time points (8–16 hrs) were done separately from later time points. Total amounts A and captured aggregates B of polyQ proteins were quantified and Aggregation Index C was calculated as described in and in Figure 2. Data from 3 independent transformants, 3 triplicates each, are presented as mean ± SE. Statistical significance between the different polyQ was calculated by split-plot ANOVA. We found p<0.0001 between 25Q and 47Q; p<0.001 between 47Q and 103Q; and no significance between experiments of each polyQ.

