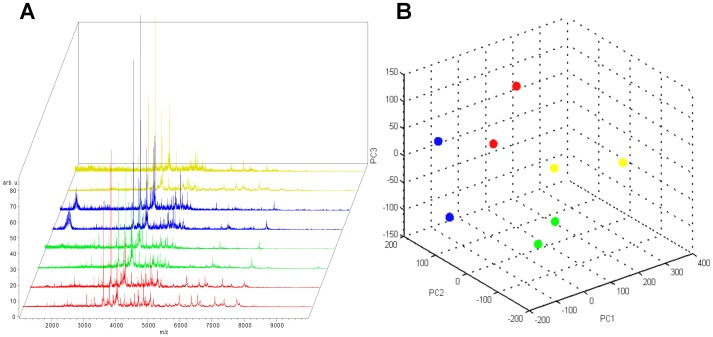
Figure 2. Reproducibility of MALDI-TOF profile spectra.
Principal component analysis (PCA) for the entire spectra (1–10 kDa) of four different samples using the ClinProTools Software (Version 2.1, Bruker Daltonics). A: Replicate spectra from one sample are colored red, green, blue and yellow in the stack view. B: Each dot in the PCA plot represents one technical replicate from two repeated sample preparations over the course of one month. Despite inevitable variations in ambient and instrument conditions, the replicates form distinct clusters according to their biological origin.

