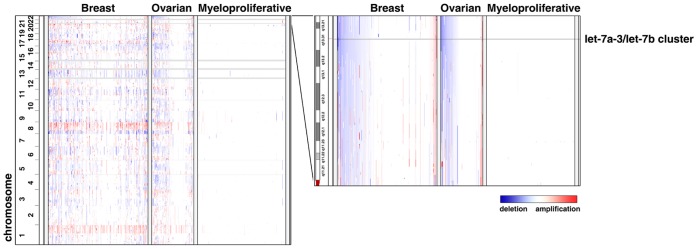
Figure 1. The genomic locus harboring the let-7a-3/let-7b cluster shows copy number deletions in breast and ovarian cancers.
The segmented raw data from the SNP arrays (breast cancer, n = 293; ovarian cancer, n = 110; myeloproliferative disorder, n = 215) was retrieved from the Tumorscape database, analyzed, then visualized by the Integrative Genomics Viewer. Left panel: whole genome wide view of the copy number profiles from myeloproliferative disorder, breast cancer, and ovarian cancer (genomic locations are on the left; tumor specimens are across the top). Red represents amplification and blue represents deletion. Right panel: Copy-number profiles of chromosome 22 in the region of the let-7a-3/let-7b cluster.

