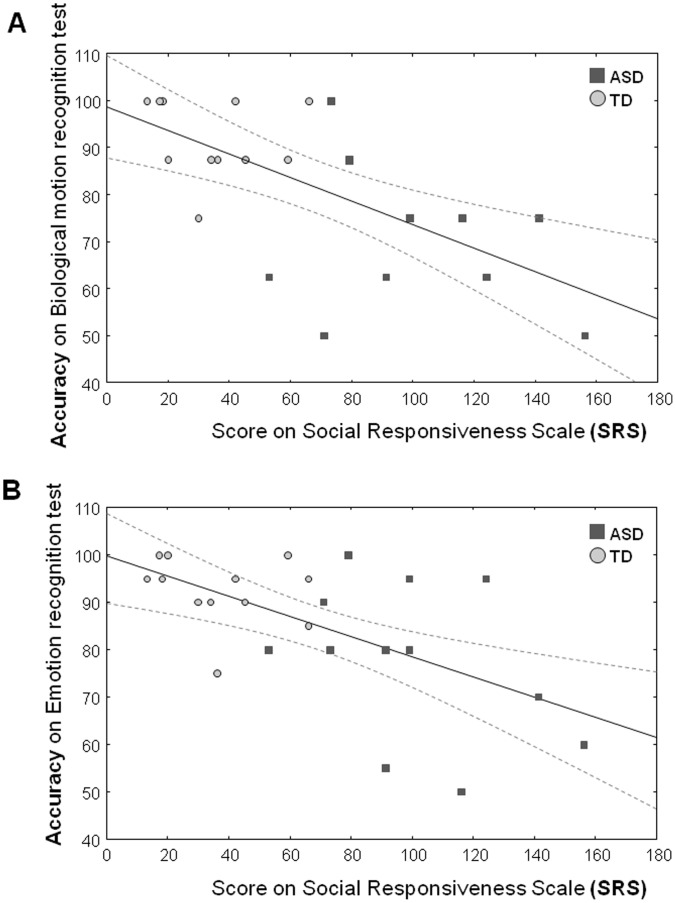
Figure 5. Across all participants, figure 5 displays the linear fits for the relationship between scores on the social responsiveness scale (SRS) (x-axis) and accuracy (y-axis) on the Biological motion recognition test (A) and the Emotion recognition test (B).
Dotted lines denote 0.95 confidence intervals.

