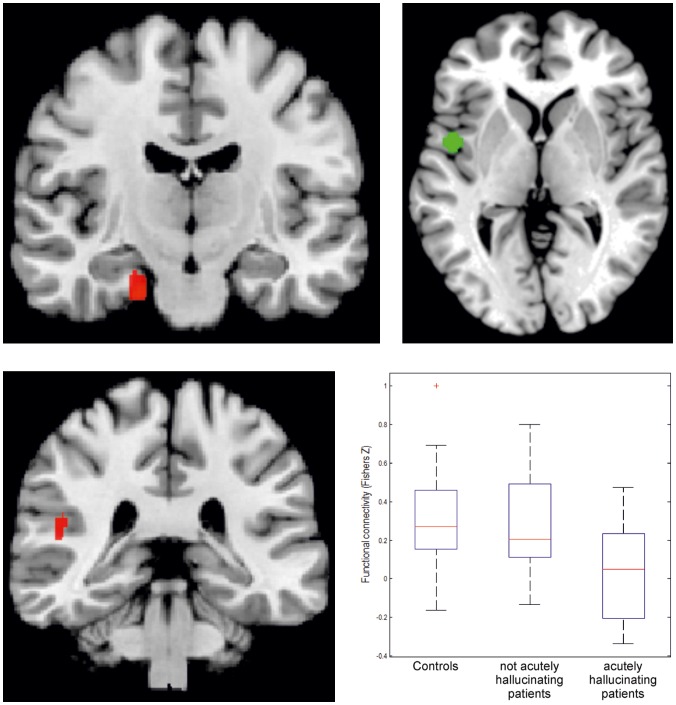
Figure 4. Differences in connectivity with lSTG, specified for patients who hallucinated during the scans and those who did not.
A. Aberrations in functional connectivity between lSTG and the left entorhinal cortex gyrus differentiate between healthy controls. Separate findings are shown for patients showing the AVH trait and those acutely experiencing AHV (state). B. Aberrations in functional connectivity between lSTG and the left temporo-parietal operculum/retroinsular cortex differentiate between healthy controls. Separate findings are shown for the patients showing the AVH trait and those patients acutely experiencing AHV during the scan (state). The red crosses in these box plots represent data points outside 1.5 * IQR, i.e. outliers.

