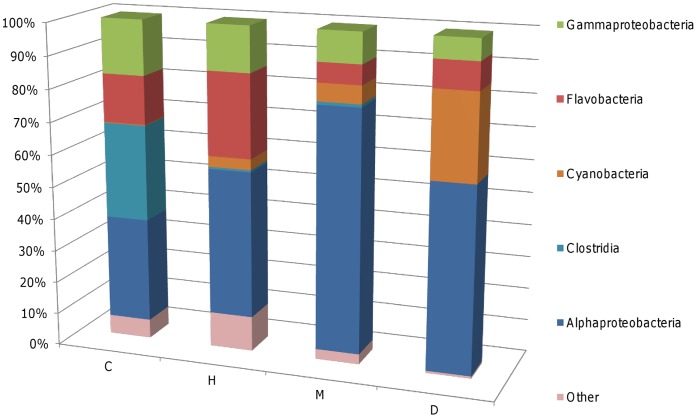
Figure 3. Relative proportions of major bacterial taxa in sequenced OTUs from each sample category.
H - apparently healthy tissues of ASWS affected T. mesenterina colonies, M - the margin of disease lesions, D - exposed skeleton adjacent to the margin and C - healthy control colonies. Stacked bars were calculated from the mean numbers of clones belonging to each taxa in each sample category. Only OTUs identified by 16S rRNA gene sequence analysis are presented.

