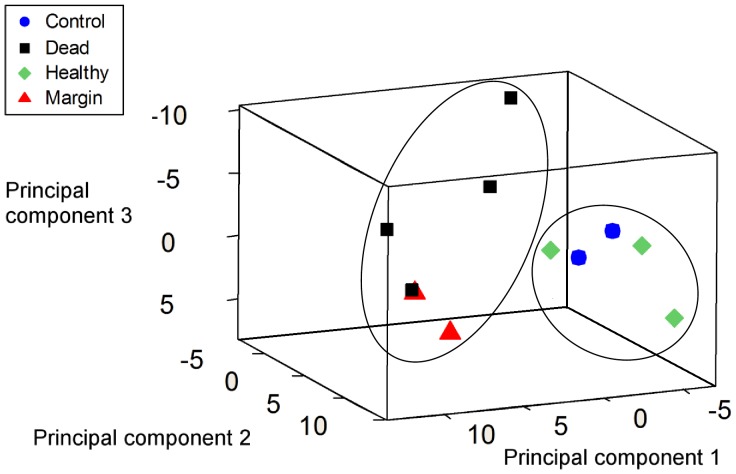
Figure 4. Three dimensional principal component plot of OFRG data.
Plot represents the first three principal components, which represent 52% of the variability in the data (Table 4). The samples grouped into two clusters (indicated by circles), consisting of a ‘healthy tissue’ cluster, and a ‘disease lesion’ cluster. These clusters were also supported by MRPP analysis. H - apparently healthy tissues of ASWS affected T. mesenterina colonies, M - the margin of disease lesions, D - exposed skeleton adjacent to the margin and C - healthy control colonies.

